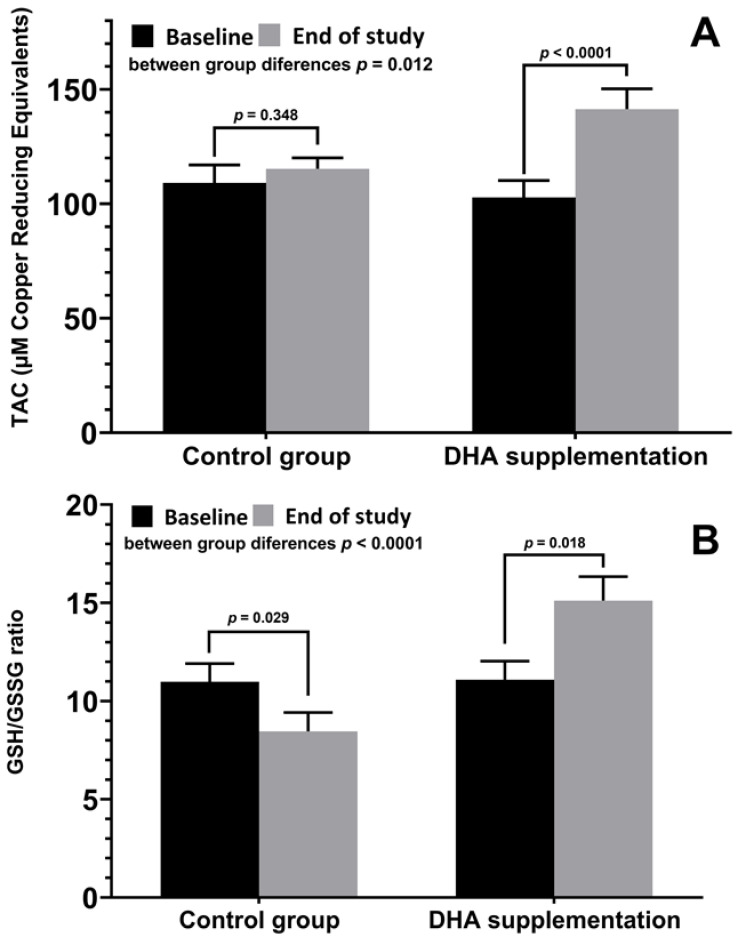
Figure 1.
(A) Changes of plasma levels of TAC (mean ± SD) at baseline and at the end of the study in patients treated with DHA supplementation and controls, with significant increases in the DHA group (p < 0.0001) and significant between-group differences (p = 0.012). (B) Changes of GSH/GSSG ratio (mean ± SD), with a significant decrease in controls (p = 0.029) as opposed to a significant increase in the DHA group (p = 0.018), with significant between-group differences (p < 0.0001).

