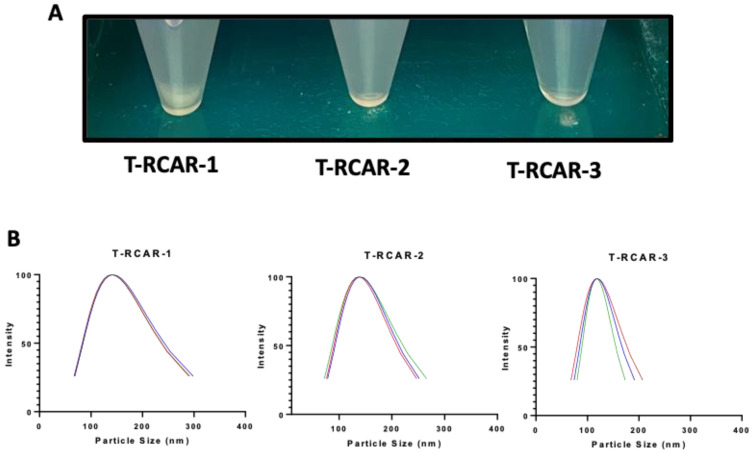
Figure 3.
Transfersome visualization and size distribution after one year of storage in the refrigerator. (A) Photo of formulations after storage at 4 °C for one year. (B) Transfersome size distribution for the T-RCAR-1, -2, and -3 after storage for one year at 4 °C. The data plotted for each formulation are the triplicated reading for one sample (n = 1). Lines in different color: the particle size analysis was run three times for each formulation.

