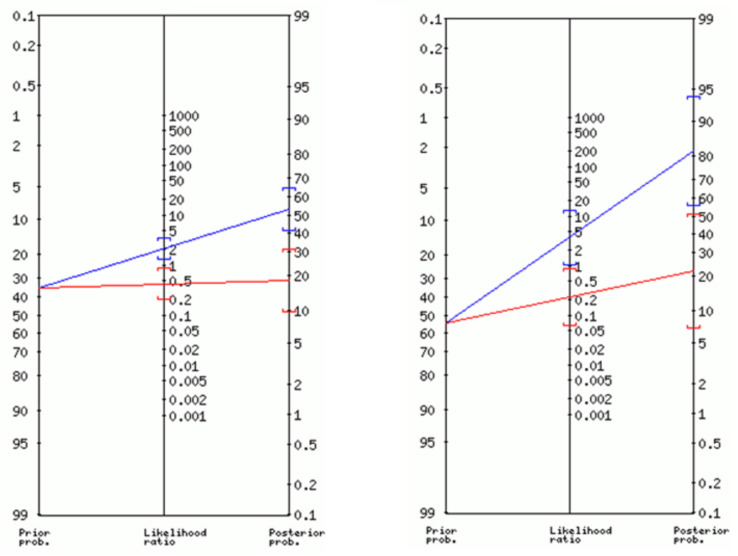
Figure 3.
Post-test positive (blue line) and negative (red line) probabilities of malnutrition in candidates on the waiting list for kidney transplantation (left) and in the subgroup of subjects with BMI < 25 kg/m2 (right). Nomograms computed with the ‘Diagnostic Test Calculator’ (available at araw.mede.uic.edu).

