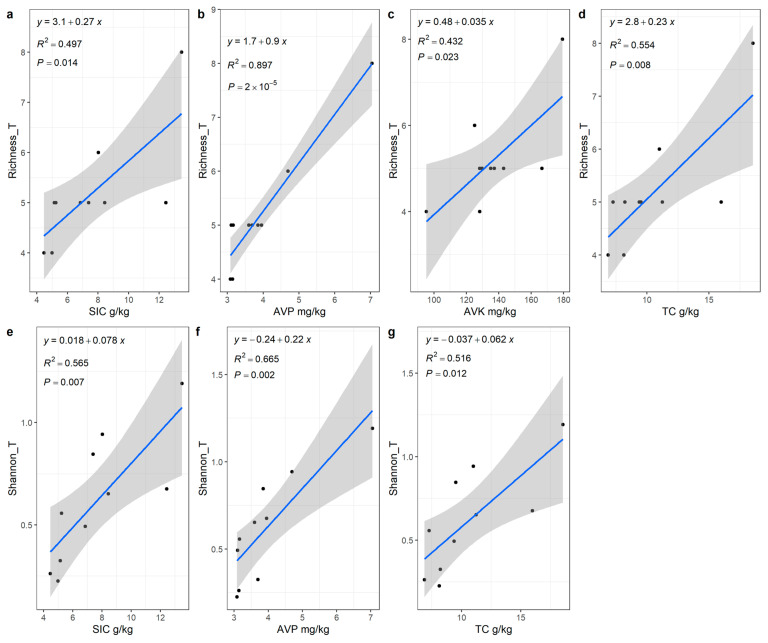
Figure 2.
Linear regression analysis of plant diversity and soil content in Tetraena mongolica community. (a–d) shows the linear regression of whole plant richness index with SIC (a), AVP (b), AVK (c) and TC (d), respectively. (e–g) shows the linear regression of Shannon diversity index and SIC (e), AVP (f) and TC (g), respectively. In the figure, the suffix “_T” represents the whole plant.

