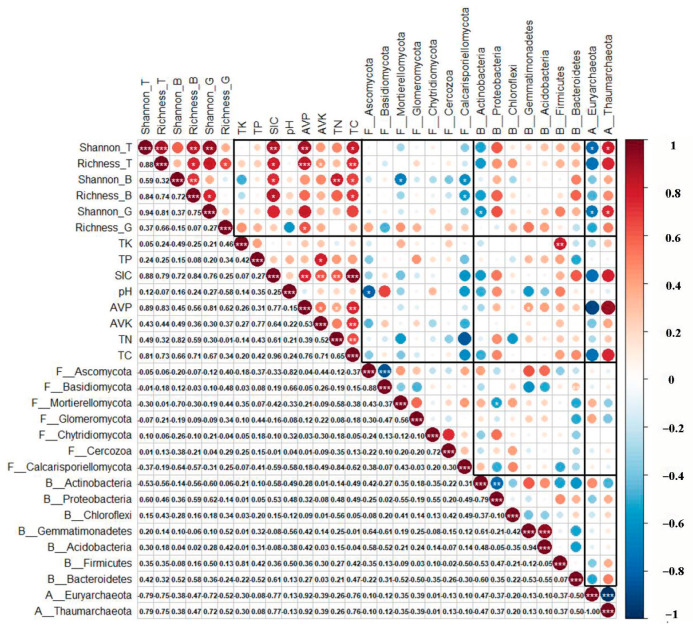
Figure 3.
The correlation between plant diversity and relative abundance of soil microbial phylum in Tetraena mongolica community. Different colors represent different positive and negative correlations and the magnitude of correlations. The specific values of correlations are shown in the lower part of the figure. “*” means significant difference, that is, p < 0.05; “**” means the difference is very significant, that is, p < 0.01; “***” means the difference is extremely significant, that is, p < 0.001. In this figure, the suffix “_T” represents the total plant as a whole, the suffix “_B” represents the bush, the suffix “_G” represents the herb, the prefix “F_” represents the fungus, the prefix “B_” represents the bacterium, and the prefix “A_” represents the archaea.

