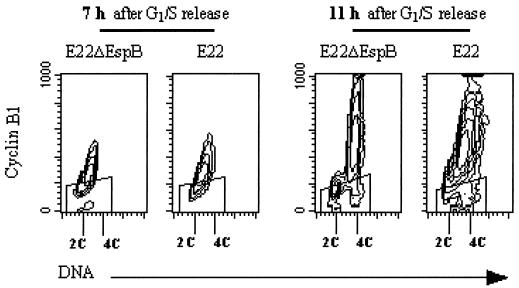
FIG. 8.
Evolution of cyclin B1 content in synchronized cells exposed to E22 or E22ΔEspB. HeLa cells were synchronized at the G1/S border and exposed for 4 h to bacteria starting at the time of release. The cells were harvested 7 and 11 h after release and processed for bivariate flow cytometry analysis. Cyclin B1 was labeled by FITC indirect immunofluorescence, and DNA was labeled by propidium iodide. Contour maps of cyclin B1 as a function of DNA content are shown. The “windows” represent the level of nonspecific fluorescence, i.e., fluorescence of the cells that were treated with irrelevant isotypic IgG rather than antibodies against cyclin.

