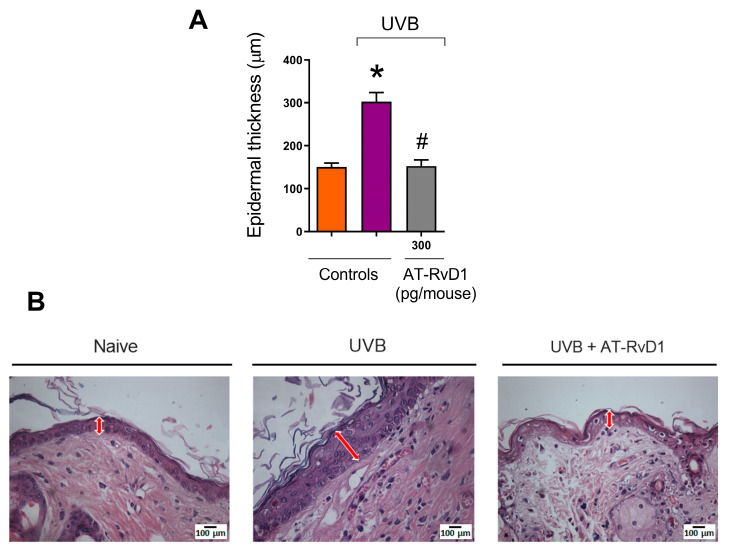
Figure 2.
Effect of AT-RvD1 on epidermal hyperplasia of hairless mice exposed to 4.14 J/cm2 UVB radiation. Epidermal thickness (µm) (A) and representative images of the epidermal thickness of the three tested groups—H&E stain (B). Skin samples were collected 12 h after the exposure. Arrows indicate representative epidermal thickness. Bars represent means ± SEM. Two separate experiments with five groups of 5 mice per group per experiment were performed. Statistical analysis was performed by one-way ANOVA, followed by Tukey´s post hoc test. * p < 0.05 compared to the nonradiated control group (orange bar); # p < 0.05 compared to the radiated control group (purple bar).

