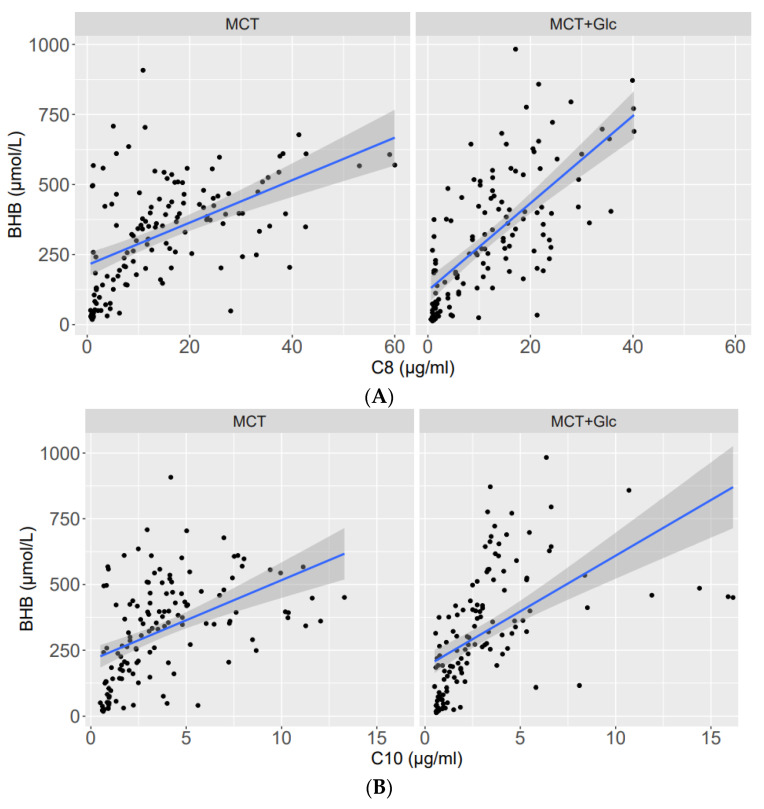
Figure 8.
(A): C8—related plasma BHB levels with MCT (left) and MCT plus glucose (right). The indicated line represents the best fit of a linear regression with plasma C8 (µg/mL). (B): C10—related plasma BHB levels with MCT (left) and MCT plus glucose (right). The indicated line represents the best fit of a linear regression with plasma C10 (µg/mL).

