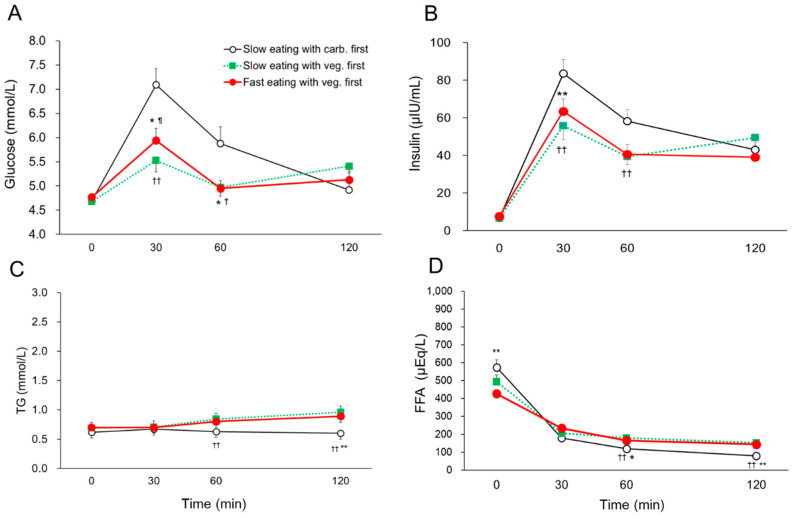
Figure 3.
The postprandial blood glucose (A), insulin (B), TG (C), and FFA (D) concentrations at 0, 30, 60, and 120 min in the three different study days on which identical meals were consumed with different eating speed and food order in young, healthy women (n = 18). Data are mean ± SEM. TG; triglyceride, FFA; free fatty acid. veg.; vegetables, carb.; carbohydrate. Slow eating with carb. first vs. Fast eating with veg. first; p < 0.05 *, p < 0.01 **. Slow eating with carb. first vs. Slow eating with veg. first; p < 0.05 †, p < 0.01 ††. Slow eating with veg. first vs. Fast eating with veg. first; p < 0.05 ¶.

