. 2023 Feb 13;12:e82112. doi: 10.7554/eLife.82112

Figure 2. Csf1 CKOAdipoq mice have high trabecular bone mass in long bone.

(A, B) Csf1 CKOAdipoq mice have normal body weight (A) and femoral length (B) at 1, 3, and 6 months of age. n=5–7 mice/group. (C) Tooth eruption is also normal in CKO mice at 1 month of age. (D) qRT-PCR analysis of Csf1 mRNA in bone marrow and cortical bone of control (Ctrl) and Csf1 CKOAdipoq mice at 3 months of age. n=3–6 mice/group. (E) 3D microCT reconstruction of femoral secondary spongiosa region from 1-, 3-, and 6-month-old mice reveals a drastic increase of trabecular bone in female Csf1 CKOAdipoq mice compared to control mice. Scale bar = 100 µm. (F) MicroCT measurement of trabecular bone structural parameters. BV/TV: bone volume fraction; BMD: bone mineral density; Tb.N: trabecular number; Tb.Th: trabecular thickness; Tb.Sp: trabecular separation; SMI: structural model index. n=4–8 mice/group. *, p<0.05; **, p,0.01; ***, p<0.001 CKO vs control.

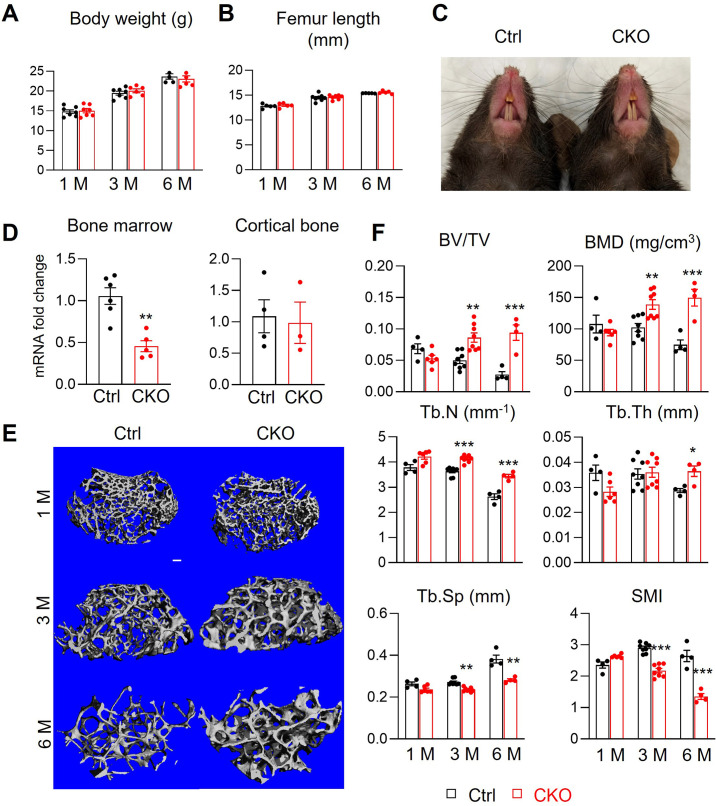
Figure 2—source data 1. Full dataset for Figure 2A.
Figure 2—source data 2. Full dataset for Figure 2B.
Figure 2—source data 3. Full dataset for Figure 2D.
Figure 2—source data 4. Full dataset for Figure 2F.

Figure 2.

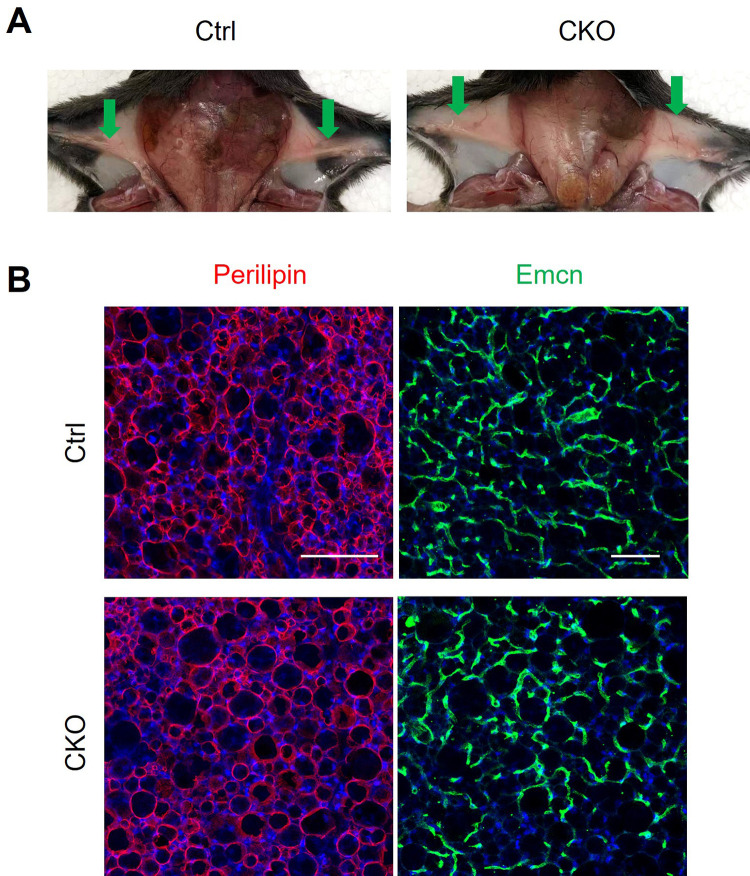
Figure 2—figure supplement 1. Csf1 CKOAdipoq mice have normal subcutaneous fat pad.

Figure 2—figure supplement 1.

(A) Representative photographs showing subcutaneous fat pad tissues (pointed by arrows) in control and Csf1 CKOAdipoq mice. (B) Representative adipocyte (Perilipin) and vessel (Emcn) staining images in subcutaneous fat. Scale bar = 100 µm (Perilipin) or 200 µm (Emcn).
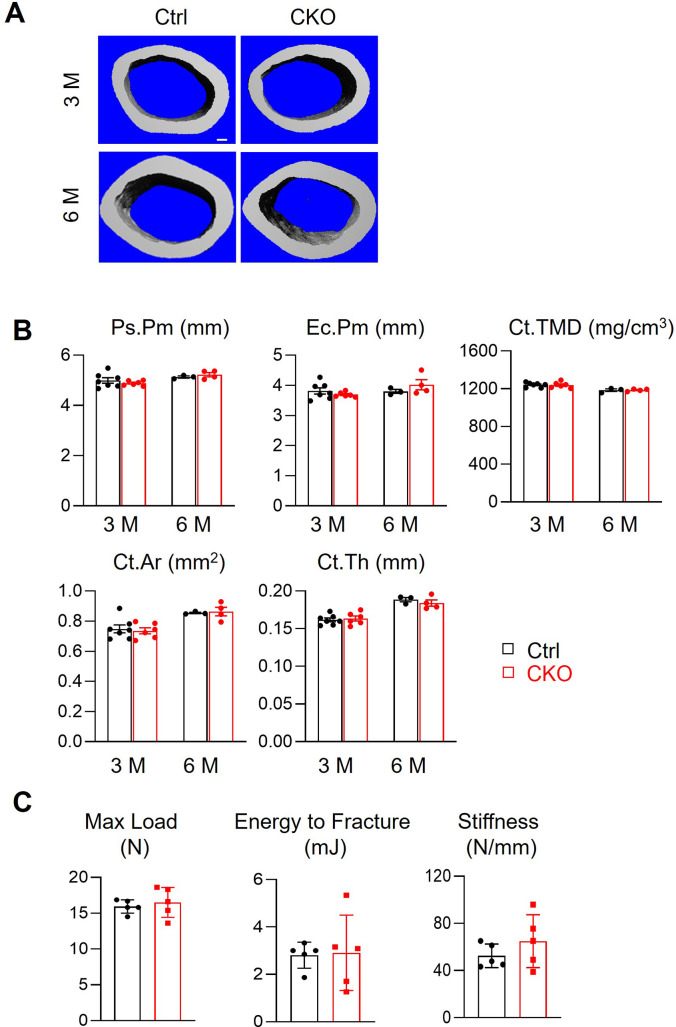
Figure 2—figure supplement 2. Csf1 CKOAdipoq mice have normal cortical bone structure and mechanical properties.

Figure 2—figure supplement 2.

(A) 3D microCT reconstruction of femoral midshaft region from 3- and 6-month-old female control and Csf1 CKOAdipoq mice. Scale bar = 100 µm. (B) MicroCT measurement of cortical bone structural parameters of 6-month-old mice. Ps.Pm: periosteal perimeter; Ec.Pm: endosteal perimeter; Ct.TMD: cortical tissue mineral density. Ct.Ar: cortical area; Ct.Th: cortical thickness. n=3–7 mice/group. (C) Three-point bending test was performed on mouse femurs. n=5 mice/group.
Figure 2—figure supplement 2—source data 1. Full dataset for Figure 2—figure supplement 2B.
Figure 2—figure supplement 2—source data 2. Full dataset for Figure 2—figure supplement 2C.
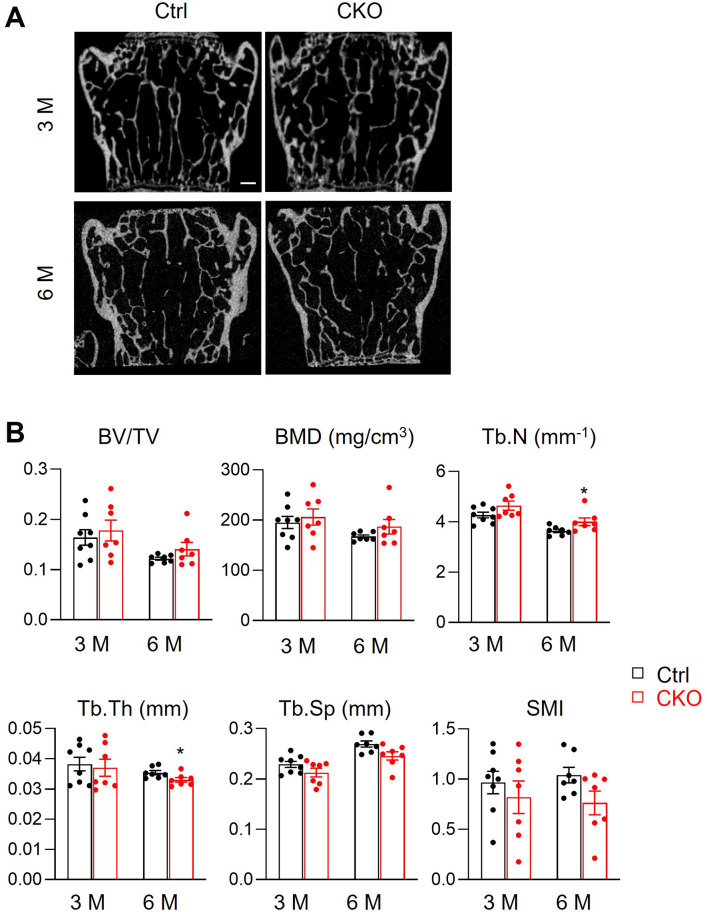
Figure 2—figure supplement 3. Csf1 deficiency in MALPs does not affects vertebral bone.

Figure 2—figure supplement 3.

(A) 2D microCT reconstruction of vertebrae from control and Csf1 CKOAdipoq mice at 3 and 6 months of age. Scale bar = 250 µm. (B) MicroCT measurement of trabecular bone structural parameters in vertebrae. BV/TV: bone volume fraction; BMD: bone mineral density; Tb.N: trabecular number; Tb.Th: trabecular thickness; Tb.Sp: trabecular separation; SMI: structural model index. n=6–7 mice/group. *, p<0.05 CKO vs control.
Figure 2—figure supplement 3—source data 1. Full dataset for Figure 2—figure supplement 3B.