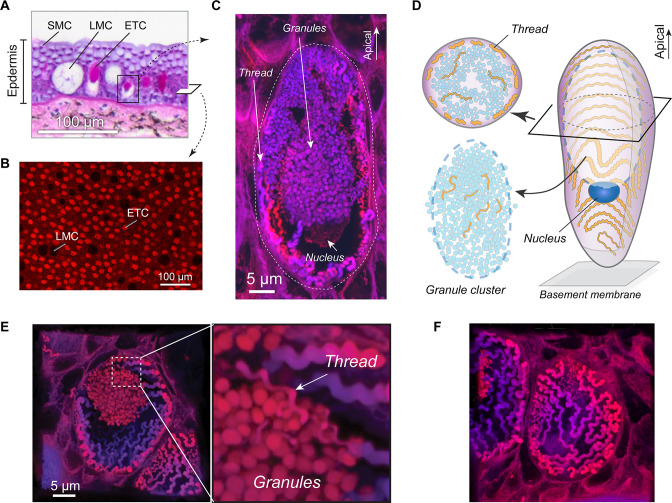
Figure 2. Morphology of the hagfish epidermal thread cell.
(A) Cross-section of dorsal epidermis from a Pacific hagfish (Eptatretus stoutii; hematoxylin-eosin-stained; bright-field microscopy). SMC, small mucous cell; LMC, large mucous cell; ETC, epidermal thread cell. (B) The basal layer of epidermis containing epidermal thread cells and large mucous cells, as captured in en face view. ETCs are characterized by granules and threads stained with the fluorescent stain eosin; LMCs appear as circular voids. (C) Longitudinal cross-section of an ETC, showing a cluster of granules, the nucleus located at the basal region of the granules, and a helical thread located mainly along the inner surface of the plasma membrane. (D) Schematic of major cellular components of an ETC. (E) Oblique cross-section of an ETC, showing the relative positions of the granule cluster and threads. Enlarged area shows a region where the thread is intimately associated with the granule cluster. (F) A close-up of the inner plasma membrane, showing the thread packed in a single layer in a switchback pattern. All images were captured with confocal microscopy unless otherwise noted.


