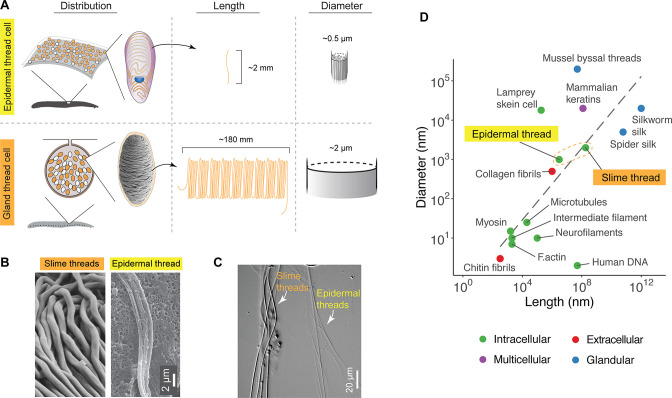
Figure 5. Comparison of distribution, size, and shape between epidermal and slime threads.
(A) A schematic comparison of the distribution of epidermal and gland thread cells, as well as the mean lengths and diameters of corresponding thread products. Data based on Pacific hagfish (Eptatretus stoutii). (B) A comparison of slime and epidermal threads viewed with scanning electron microscopy (SEM). Note the epidermal thread has appeared to cleave into multiple sub-threads after being stretched (see also Figure 3—figure supplement 1). (C) Two types of threads collected from the same hagfish (viewed with differential interference contrast microscopy), highlighting their difference in diameter. (D) A size comparison of epidermal and slime threads in Pacific hagfish (E. stoutii) with other biofibers. Trend line represents a linear regression model based on all data points excluding human DNA. Colors denote different fiber production mechanisms (see Zeng et al., 2021).

