. 2023 Feb 15;12:e81401. doi: 10.7554/eLife.81401

Figure 2. PhIP-seq with Falciparome captures known, novel antigens and relationships between age, exposure and breadth of seroreactive regions.

(a) Heatmap of Z-score enrichment over US controls for seroreactive peptides (rows) with >10% seropositivity across different age groups in the moderate and high exposure cohorts. Peptides are sorted by protein name and samples(columns) are ordered by increasing age in each group. Examples of well-characterized (black labels) as well as under-characterized/novel (blue labels) antigens in Plasmodium falciparum identified with this approach are indicated. (b) Breadth of antibody reactivity, shown as number of seroreactive peptides in each person. Dotted red line and red text indicate median breadth for each population group. Children from the moderate transmission setting had significantly lower breadth than children from the high transmission setting as well as all adults (KS test p-value <0.05). (c) Number of proteins identified as seroreactive in this study that are specific to different stages. Stage classification is based on proteomic datasets in PlasmoDB (spectral count ≥ 1 for at least 1 peptide in a protein in a given stage is counted as expression) and shows enrichment of proteins from all life stages of Plasmodium falciparum in the human host. (d) Breadth of VSA reactivity, shown as number of variant proteins of RIFINs, STEVORs, and PfEMP1s seroreactive per person. In the moderate transmission setting, children had a significantly lower breadth than adults for PfEMP1 and both age groups poorly recognized RIFINs and STEVORs. In contrast, in the high transmission setting, children had a significantly (* KS test <0.05) higher breadth than adults for all three families.

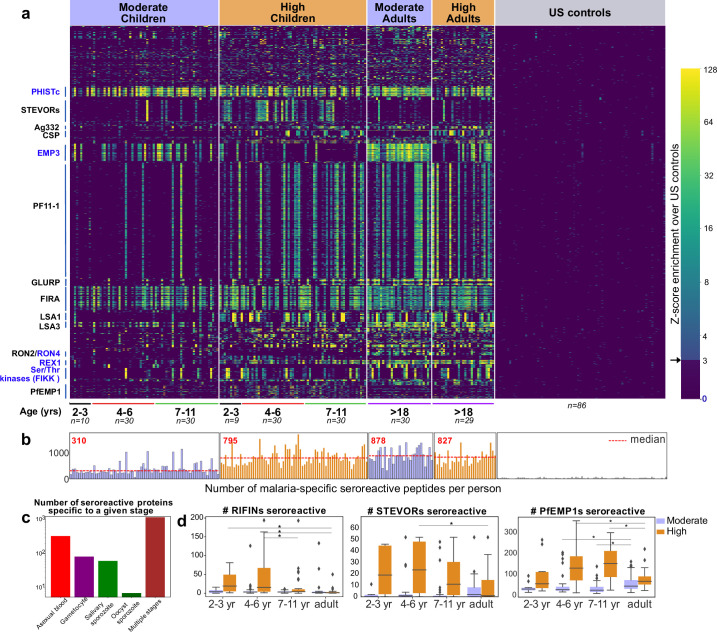
Figure 2—source data 1. GO analysis of top seroreactive proteins.

Figure 2.

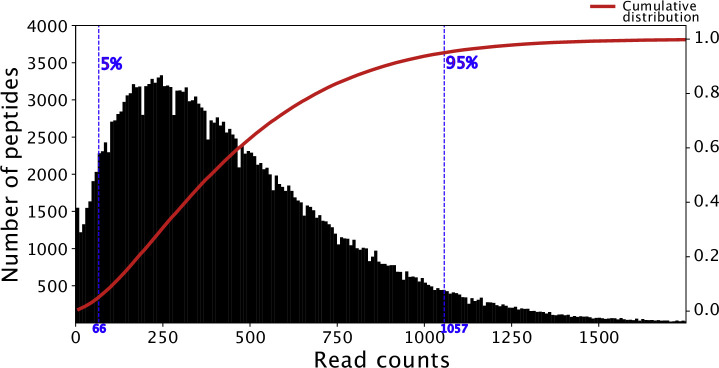
Figure 2—figure supplement 1. Histogram of read counts of Falciparome phage library.

Figure 2—figure supplement 1.

Read counts corresponding to the 5th and 95th percentile in the distribution (indicated in blue) are within a 16-fold difference. Cumulative density plot of the distribution is shown in red.
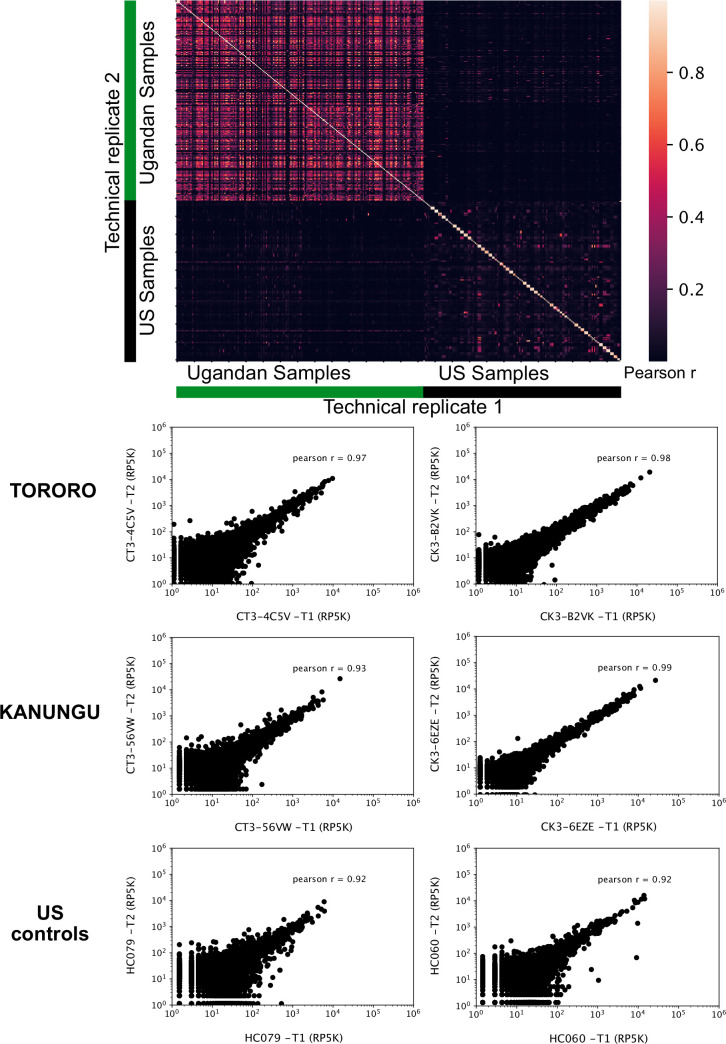
Figure 2—figure supplement 2. Technical replicates are well correlated.

Figure 2—figure supplement 2.

Top - Pearson correlation matrix of depth-adjusted read counts across all samples. Technical replicates are placed symmetrically on rows and columns. Bottom three - Representative scatter plots of reads per 500,000 (RP5K) of technical replicates of samples from Tororo, Kanungu and US.
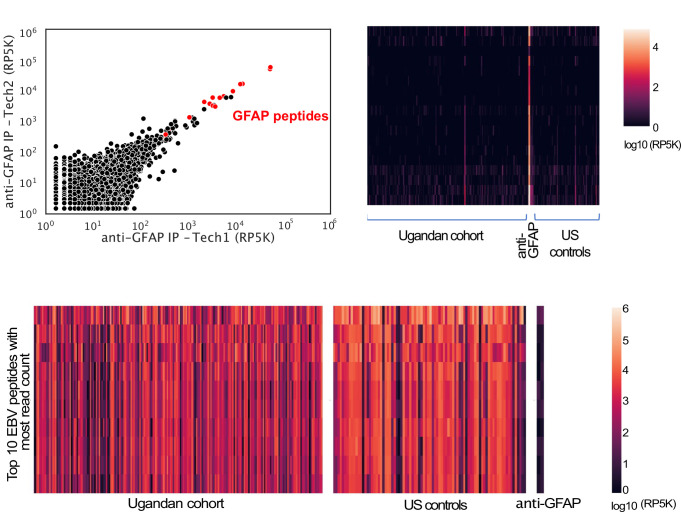
Figure 2—figure supplement 3. Target peptides are enriched in a sample-specific manner.

Figure 2—figure supplement 3.

Top panel - PhIP-seq with polyclonal anti-GFAP enriches for GFAP peptides and enrichment is specific to IP with anti-GFAP, but is observed rarely in the Ugandan cohort and US controls. Left - Scatter plot of Reads Per 500,000 (RP5K) of technical replicates of an IP with anti-GFAP. GFAP peptides are in red. Right – Heat map of RP5K of GFAP peptides (rows) in different samples (columns). Bottom panel - Heat map of RP5K of top 10 Epstein-Barr virus (EBV) peptides (rows) with highest read counts in human samples. Enrichment is observed across Ugandan and US samples, but not in the IP with anti-GFAP.
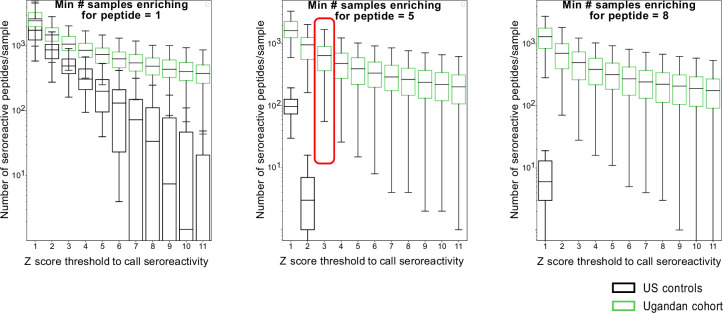
Figure 2—figure supplement 4. Moving threshold analysis to determine optimal thresholds for calling peptides as seroreactive based on minimum Z-score and enrichment in a minimum number of samples in a group.

Figure 2—figure supplement 4.

Box plots of resultant number of seroreactive peptides for corresponding thresholds are shown for Ugandan samples and US controls. The final thresholds for calling seroreactivity were selected based on minimizing the number of peptides identified as seroreactive in the US controls and is indicated by the red box.
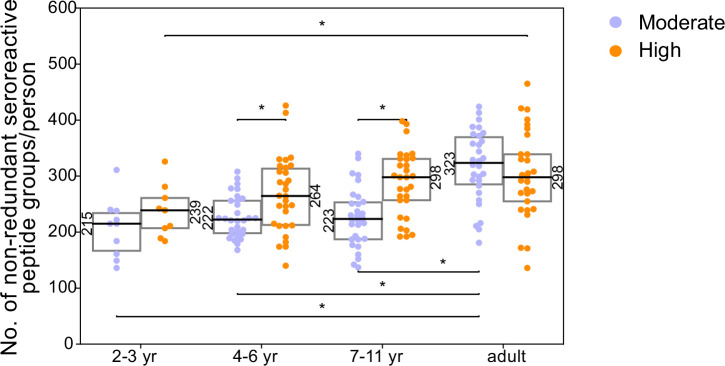
Figure 2—figure supplement 5. Breadth of non-redundant seroreactive peptide groups per person across age and exposure.

Figure 2—figure supplement 5.

All seroreactive peptides in each person were collapsed based on sequence similarity (sharing of 7mer identical motifs). The resulting number of non-redundant groups was used as a measure of conservative non-shared breadth. Children from the moderate transmission setting had a significantly lower breadth than children from the high transmission setting and all adults.* indicates p-value <0.05 by KS-test. Median for each group is labeled on the side of the box.
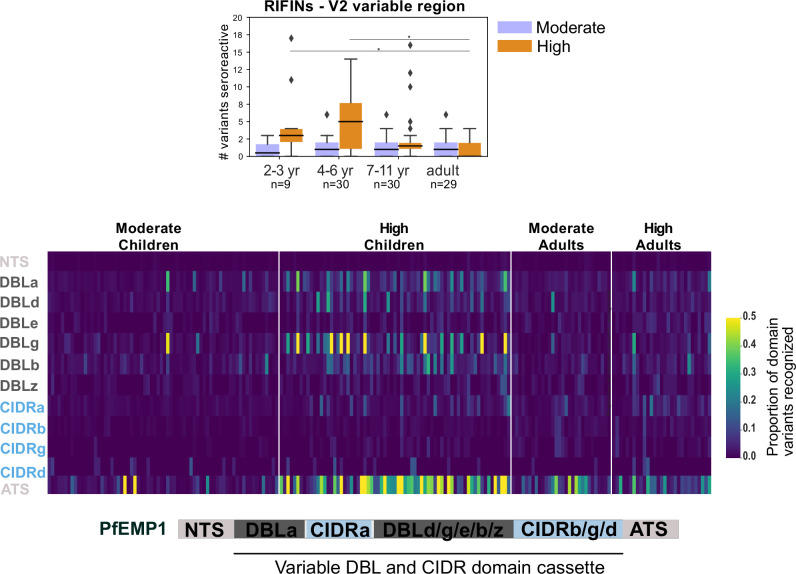
Figure 2—figure supplement 6. Breadth of seroreactivity in the variable regions of RIFIN and PfEMP1.

Figure 2—figure supplement 6.

Top - Box plot of number of domain variants seroreactive in the variable region V2 of RIFINs. Significantly different groups (KS test <0.05) are marked with an *. Bottom - Heatmap of proportion of variants from the library that are seroreactive in a given person for each PfEMP1 domain. Each column is a person. Schematic of domain structure of PfEMP1 is shown below the heatmap.