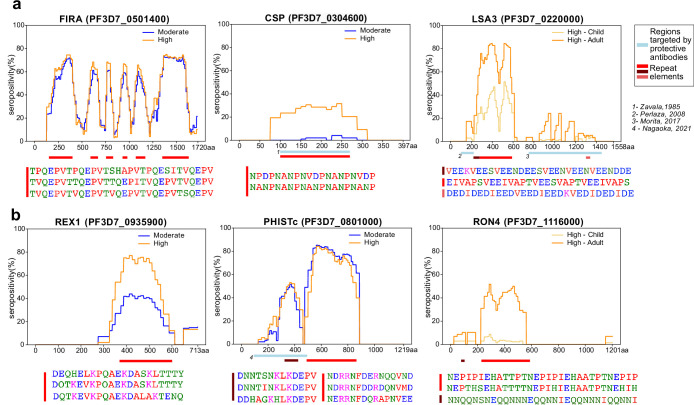
Figure 3. Tiled design of library facilitates high resolution characterization of seroreactive regions.
(a) Examples of previously well-characterized antigens and (b) novel/previously under-characterized antigens identified in this dataset. Average percentage of people seropositive at each residue (seropositivity) based on signal from peptides spanning it are shown for each protein for different groups in the cohort. The magnitude of exposure- and age-related differences in seropositivity varies by individual protein and even within different regions of specific proteins. Reddish bars underneath each protein represent repeat elements and blue bars represent examples of regions encompassing targets of protective antibodies described in previous studies. Snapshots of sequences of repeat elements present in a protein are represented beneath the protein.


