. 2023 Feb 15;12:e81401. doi: 10.7554/eLife.81401

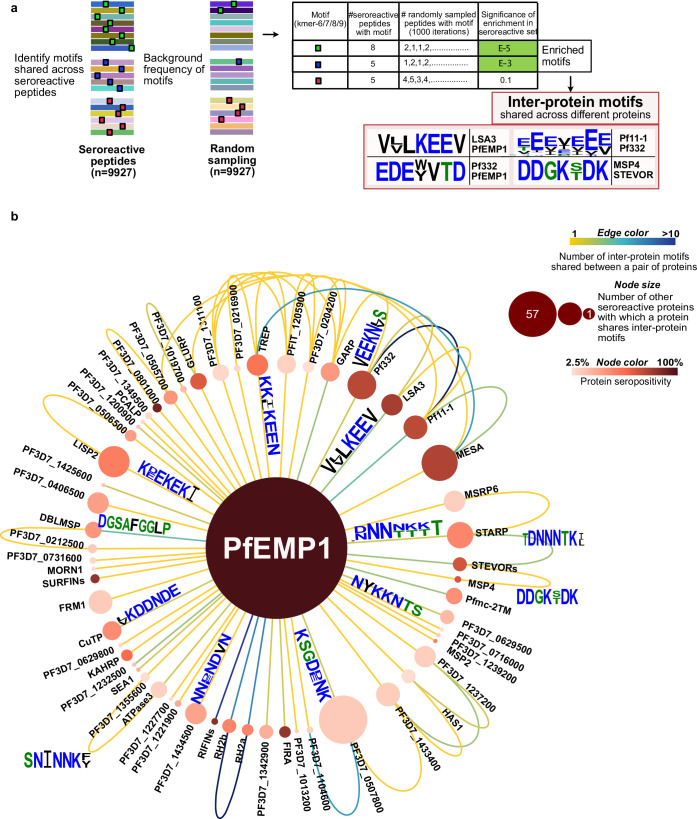
Figure 6. Extensive sharing of motifs observed among seroreactive proteins, with the most shared with PfEMP1 family.

(a) Pipeline to identify inter-protein motifs (6-9aa) significantly enriched (FDR <0.001) in seroreactive peptides from different seroreactive proteins (different colors) over background. Background for each motif was estimated based on the number of random peptides possessing the motif in 1000 random samplings of 9927 peptides. Examples of inter-protein motifs and seroreactive proteins sharing them are also shown. (b) Network of PfEMP1 sharing inter-protein motifs with other seroreactive proteins based on 7-aa motifs with up to two conservative substitutions. PfEMP1 shared inter-protein motifs with the greatest number of other seroreactive proteins.

Figure 6.

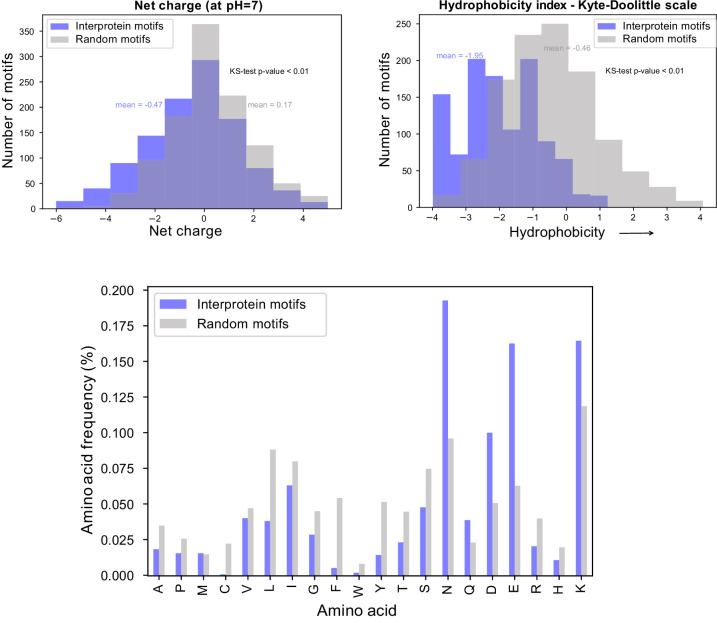
Figure 6—figure supplement 1. Biochemical characteristics of inter-protein motifs.

Figure 6—figure supplement 1.

Top - Histogram of net charge and hydrophobicity index of the 911 inter-protein motifs (7-aa motifs with at least five identical residues and up to two conservative substitutions) in comparison to a random set of 911 kmers of the same length from Pf proteome. Bottom - Distribution of amino acid frequencies in inter-protein and random motifs. All except Methionine (M) are significantly different between the two groups.
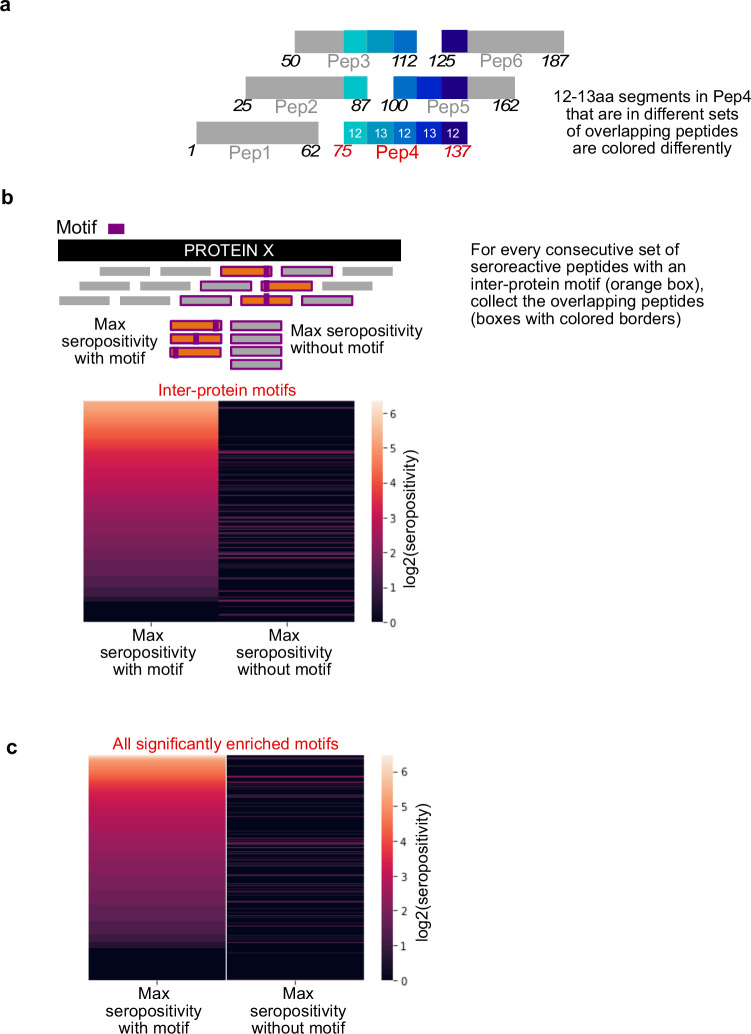
Figure 6—figure supplement 2. Inter-protein motifs are associated with seroreactivity.

Figure 6—figure supplement 2.

(a) Design of the tiled peptide library showing segments in Peptide 4 overlapping with neighboring peptides. Start and end amino acid positions of each peptide are marked at either ends. (b) Comparison of maximum seropositivity of overlapping peptides with and without inter-protein motifs. Each row in the heatmap pertains to a collection of overlapping peptides surrounding a consecutive set of seroreactive peptides with an inter-protein motif. (c) Same as in c, but for all 'enriched' motifs in seroreactive peptides.
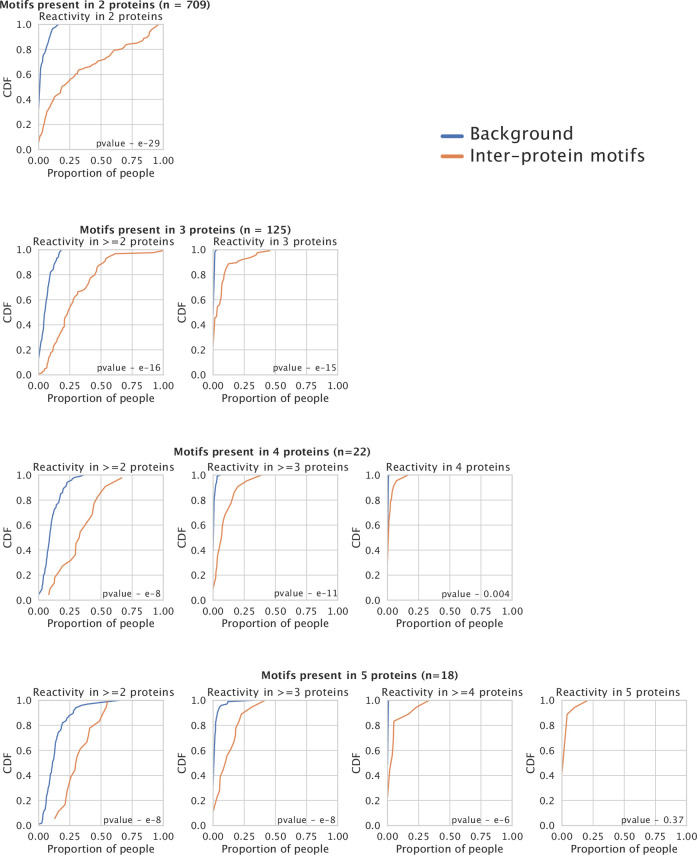
Figure 6—figure supplement 3. Co-occurrence of reactivity to peptides containing inter-protein motifs from different proteins within individuals.

Figure 6—figure supplement 3.

Each plot in orange depicts the Cumulative Distribution Function (CDF) for the proportion of people showing reactivity in >y proteins for the set of inter-proten motifs shared among n proteins. The background distribution (blue) is based on a random sampling of peptides without inter-protein motifs from different proteins and reflects the level of sharing observed by chance.
Figure 6—figure supplement 4. Histogram of number of other seroreactive proteins with which a seroreactive protein shares inter-protein motifs.
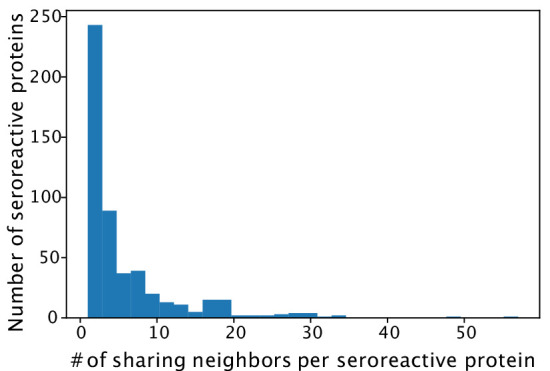
Figure 6—figure supplement 4.

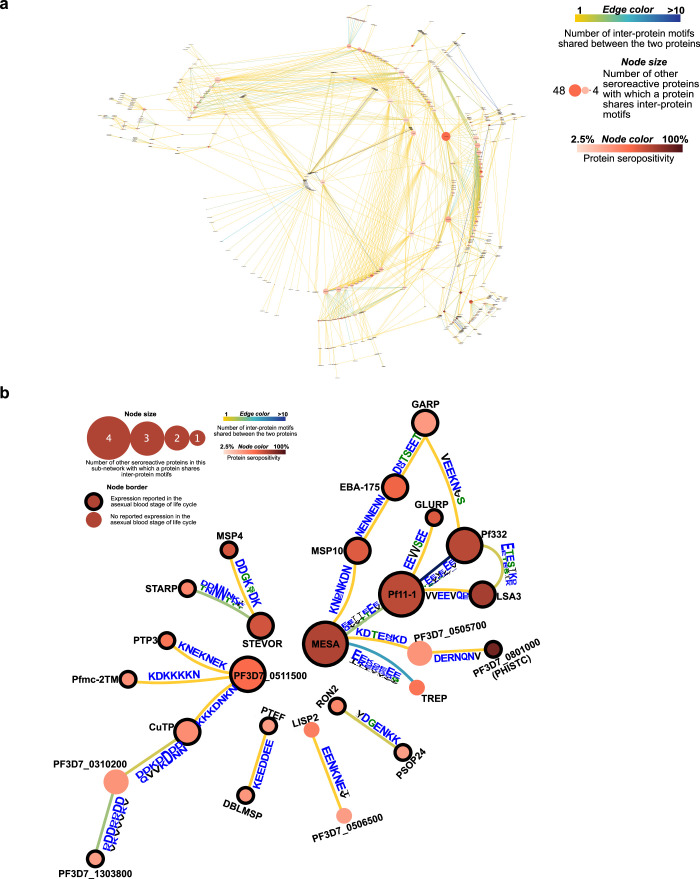
Figure 6—figure supplement 5. Network of seroreactive proteins outside the PfEMP1 network.

Figure 6—figure supplement 5.

(a) All seroreactive proteins except PfEMP1 (b) Proteins with >30% seropositivity.