Figure 3.
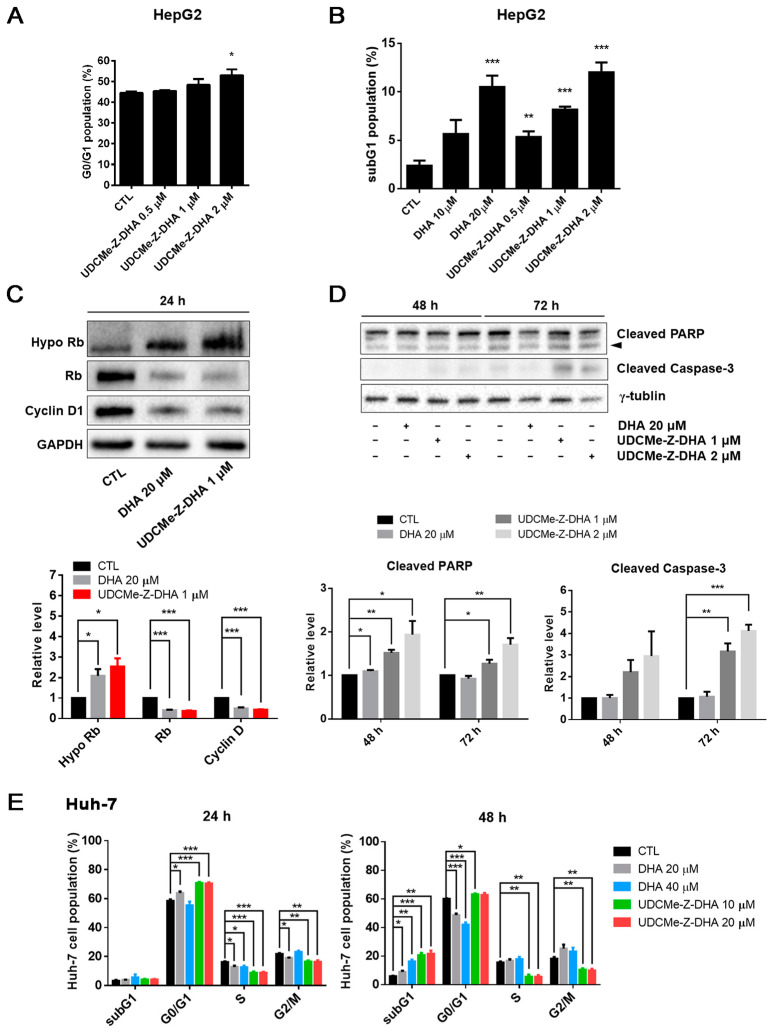
Effects of DHA and UDCMe-Z-DHA on cell cycle progression and apoptosis in HCC cells. (A) UDCMe-Z-DHA increased the G0/G1 population dose-dependently in HepG2 cells after 24 h treatment. Data are presented as mean ± SEM of 2–3 independent experiments. (B) DHA and UDCMe-Z-DHA significantly induced the subG1 population in HepG2 cells after 48 h treatment. (C) Rb and cyclin D1 protein levels in HepG2 cells treated with DHA and UDCMe-Z-DHA for 24 h. GAPDH was used as a loading control. (D) Apoptosis-related proteins in HepG2 cells treated with DHA and UDCMe-Z-DHA for 48 and 72 h. γ-Tubulin was used as a loading control. Representative images are shown in the upper panels and quantitative results are shown in the lower panels in (C,D). (E) Cell cycle distribution of Huh-7 cells treated with DHA and UDCMe-Z-DHA for 24 and 48 h. Data are presented as mean ± SEM of at least three independent experiments. Statistical significance versus the untreated vehicle control (CTL) was assessed by two-tailed Student’s t-test. * p < 0.05, ** p < 0.01, *** p < 0.001.

