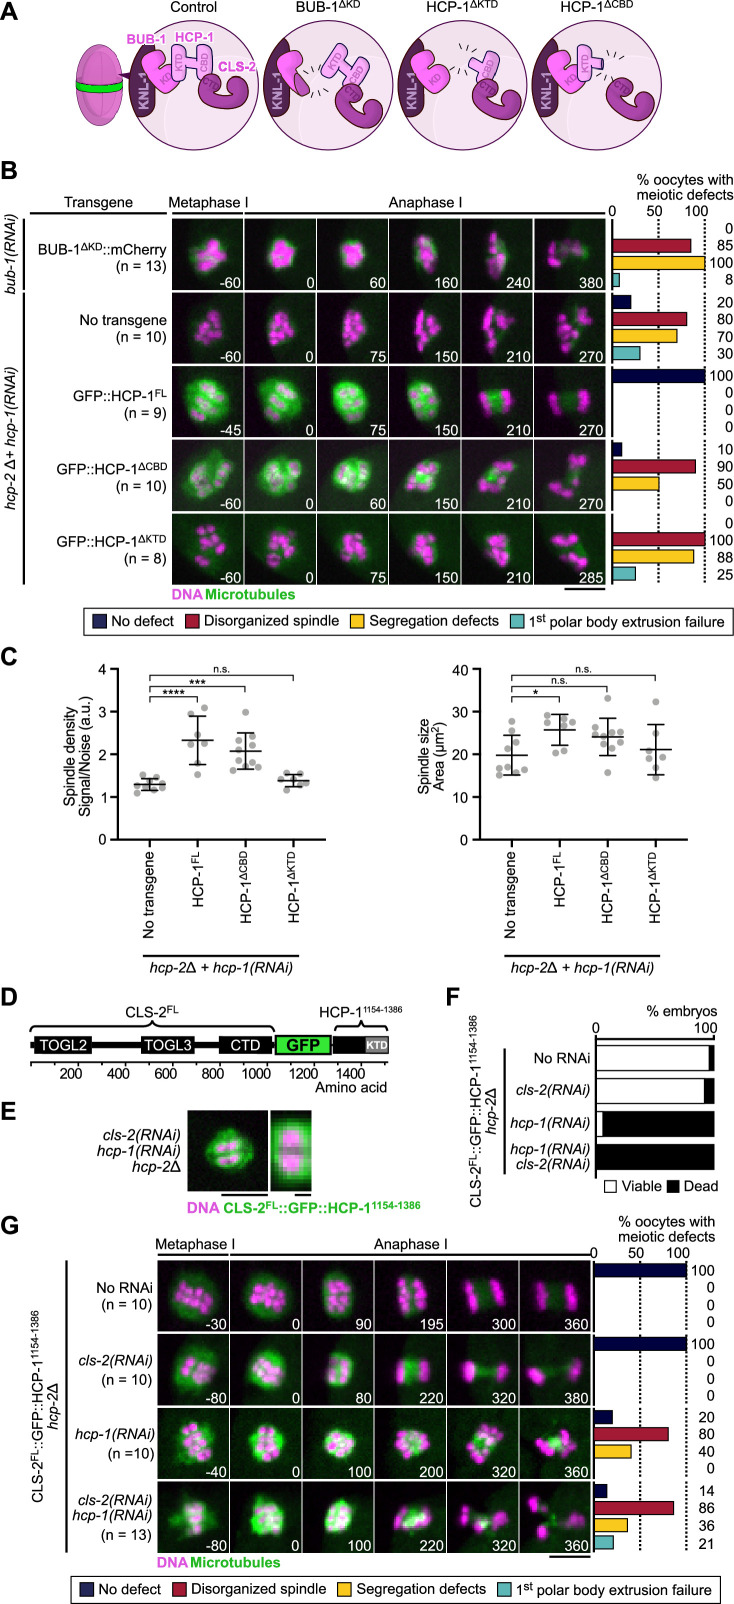
Figure 4. BHC module integrity is essential for spindle assembly and accurate chromosome segregation.
(A) Schematic of BHC-module integrity mutants. (B) Stills from live imaging of meiosis I in indicated conditions. Microtubules (GFP::TBA-2α-tubulin or GFP::TBB-2β-tubulin) in green, chromosomes (mCherry::HIS-11H2B) in magenta. Time in seconds relative to anaphase I onset. Graphs indicate quantifications as referred to in color key. (C) Plots of spindle density (corrected GFP intensity, left) and spindle area (right) 45 s before anaphase I onset. Kruskal-Wallis multiple comparisons, alpha = 0.05, *p<0.05, ***p<0.001, ****p<0.0001, n.s. not significant. Error bars, Mean with standard deviation. (D) Schematic of the CLS-2FL::GFP::HCP-11154-1386 protein fusion. The HCP-111154-1386 fragment contains the KTD. (E) Localization of CLS-2FL::GFP::HCP-11154-1386 (green) in metaphase I, and magnification of a single meiosis I chromosome. DNA (mCherry::HIS-11H2B) in magenta (n=13). (F) Embryonic lethality and (G) meiotic defects rescue assays of indicated depletions by CLS-2FL::GFP::HCP-11154-1386. Scale bars, full spindle 5 µm, single chromosome details 1 µm.


