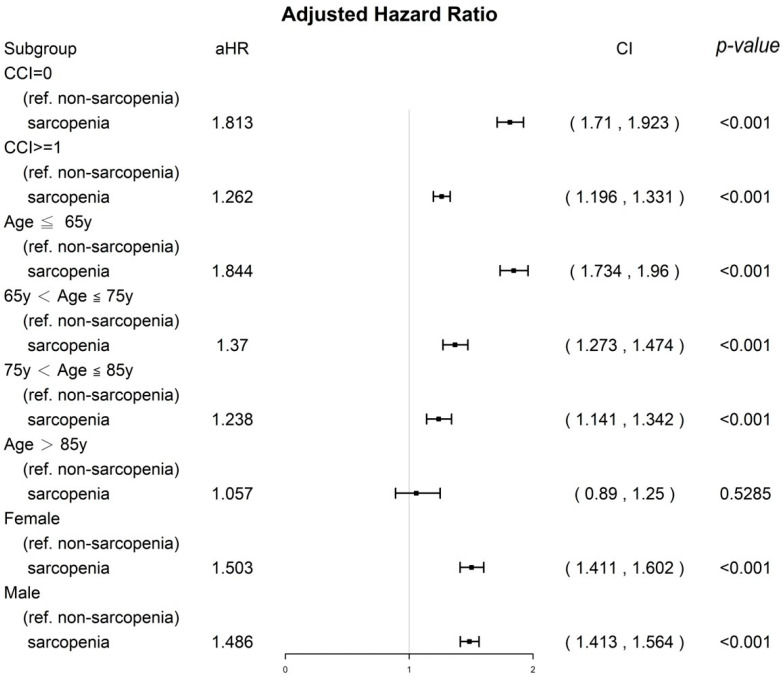
Figure 2.
A sensitivity analysis of sex, age groups, and CCI scores by using inverse probability of treatment weighting for all-cause death in the propensity score–matched sarcopenia and nonsarcopenia groups. All covariates presented in Table 2 were adjusted.

