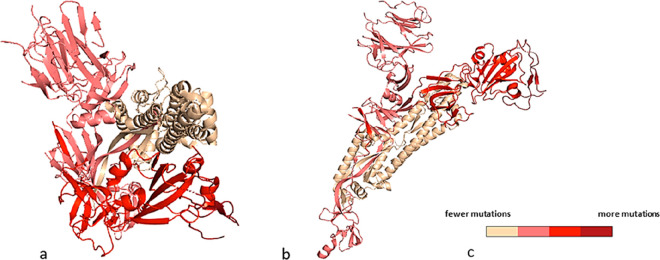
Figure 12.
Color code map obtained according to the variability measured by the authorities and reported by the WHO (Tracking SARS-CoV-2 variants (who.int) and ref (136)). Spike protein (PDB ID 6VYB(144), SARS-CoV-2 spike ectodomain structure, Omicron variant, truncated before the TM region): (a) top and (b) side views. (c) Legend. The color key indicates the relative frequencies of single amino acid variations (insertions, deletions, and mutations) for each residue according to the screened single amino acid variants of concerns, from the sequences downloaded from the Global Initiative on Sharing All Influenza Data (GISAID).136 The degree of mutation was obtained by dividing the measured frequency incidence by the length of the considered sequence. The quantitative color code map was generated with PyMol (Version 2.5.2). Overall, the lowest mutation rate is associated with the less exposed regions on S2 subunit, whereas, not surprisingly, RBD accounts for the highest mutation frequency.

