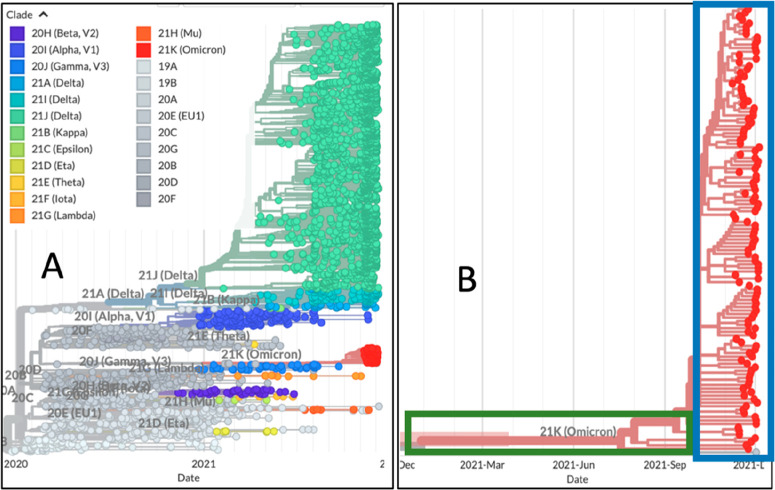
Figure 19.
Snapshot of the phylogeny description of SARS-CoV-2 genomes sampled worldwide (between December 2019 and December 2021). In panel (A) this phylogeny shows evolutionary relationships of SARS-CoV-2 viruses from the ongoing novel coronavirus pandemic with a particular focus on Europe. Additional sequences from the rest of world were added. This picture shows how different outbreaks are connected and how the virus might have spread around the globe. Direct linkage on the tree does not necessarily mean there exists a direct epidemiological link. All data used (European and international) are deposited in GISAID. Each dot represents a variant case, isolated somewhere in the world. The different color indicates a different variants clade. The horizontal line indicates the divergence number. With time the divergence increases. (B) Phylogeny of SARS-CoV-2 genomes as in A, but Omicron variants only are shown. Adapted from https://nextstrain.org/groups/neherlab/ncov/global?c=clade_membership&p=grid&r=division.237

