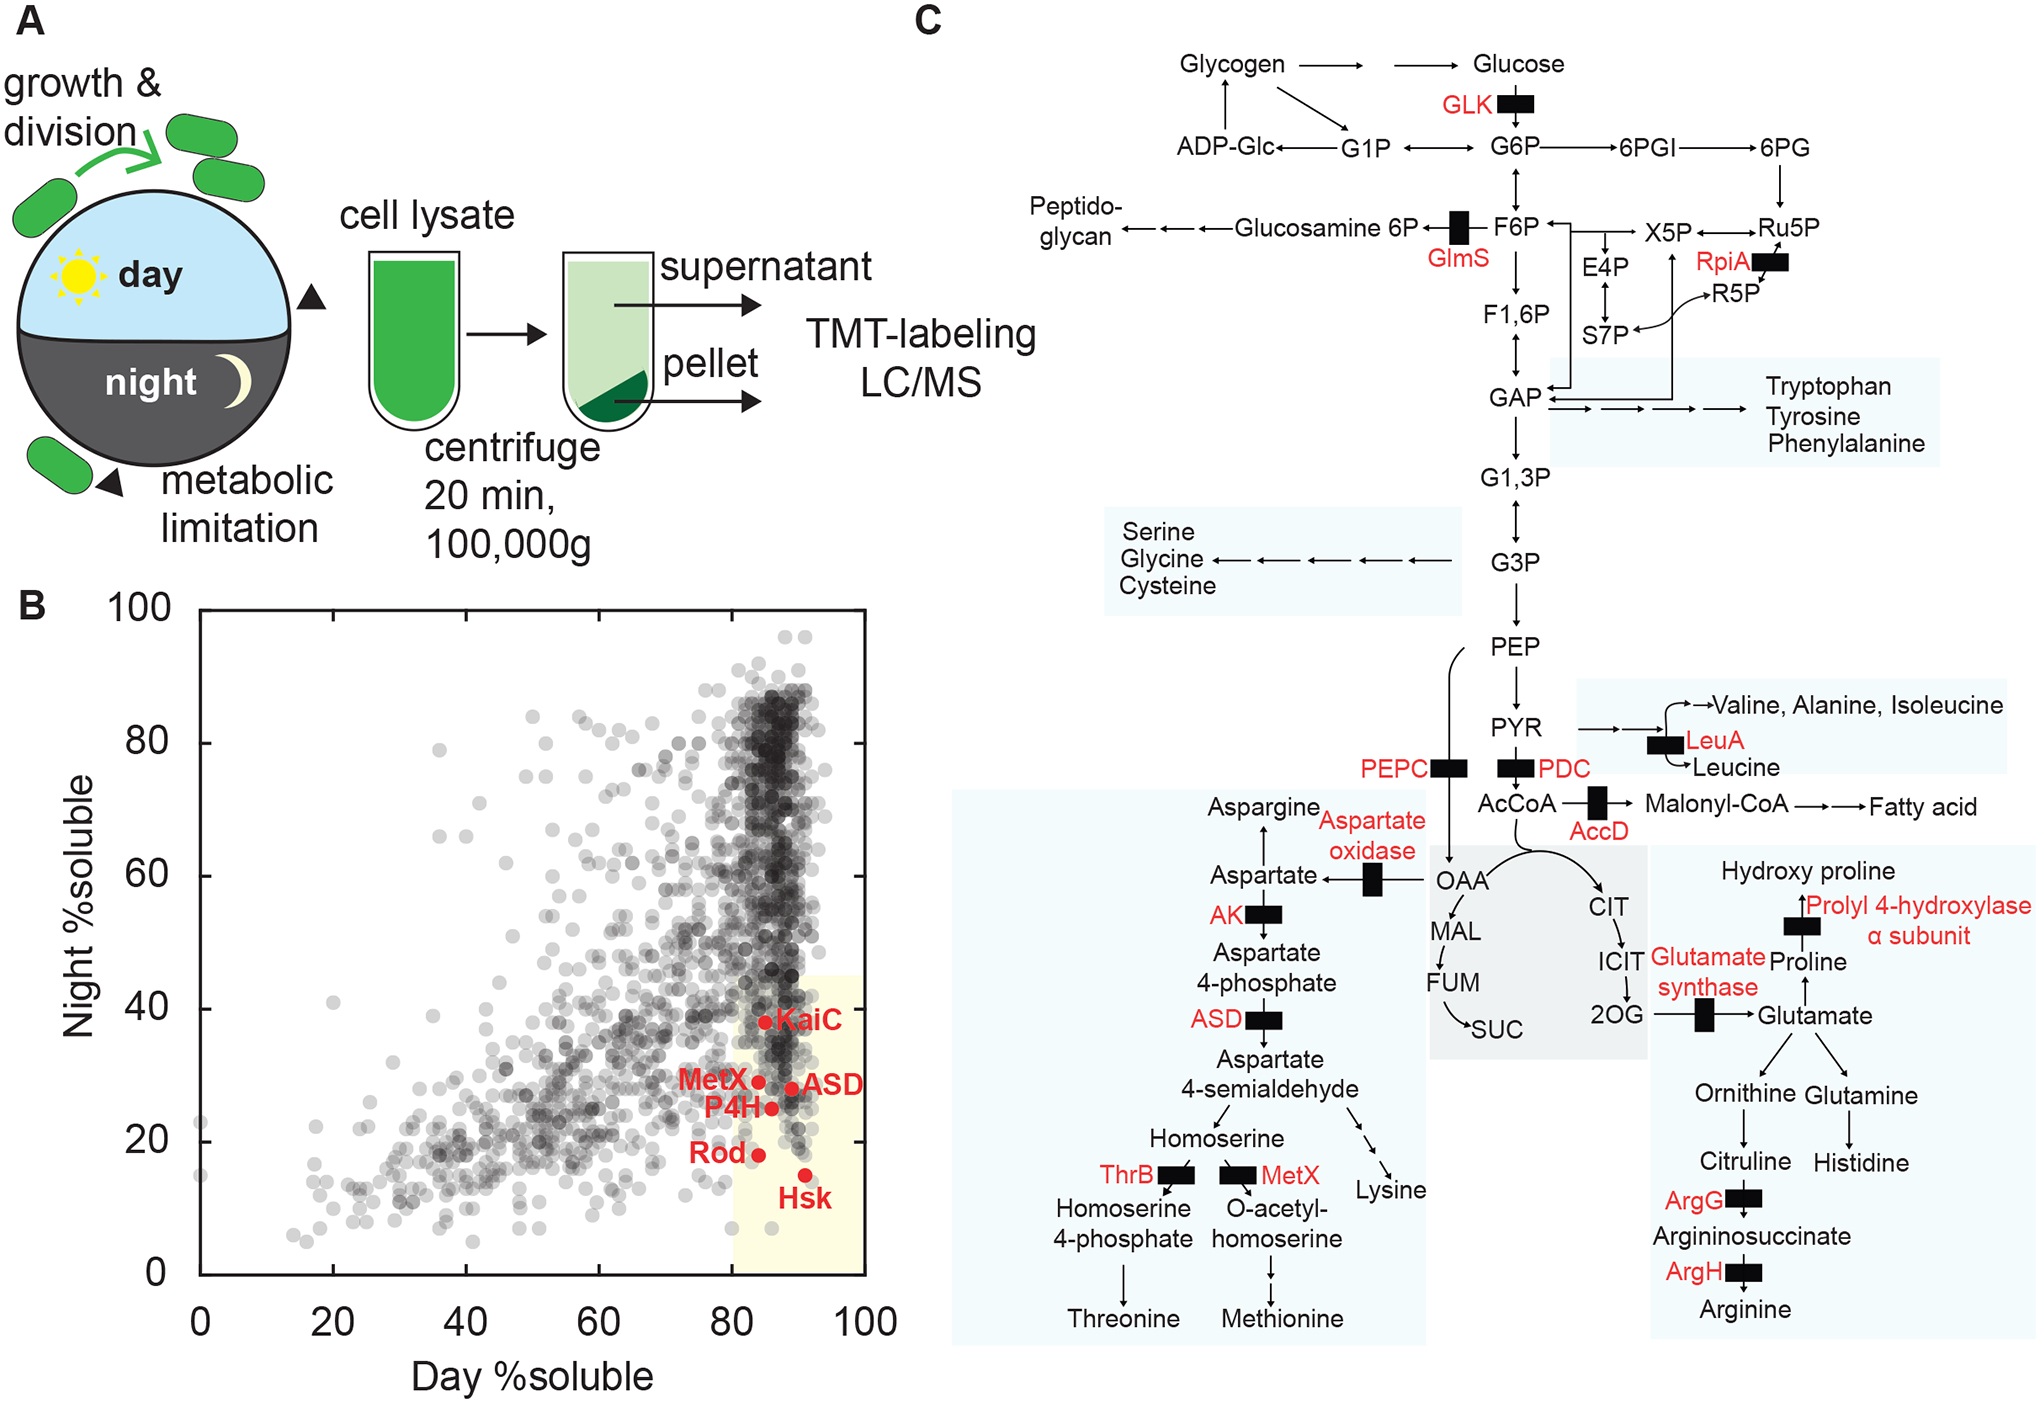
Figure 1. Protein Condensation in the Cyanobacterial Proteome During the Day-Night Cycle.

(A) Schematic of experimental design. Wild-type cell cultures were synchronized by one light-dark cycle. Cells were harvested at the end of the day and 8 h into the dark (arrowheads). Cells were lysed and fractionated by ultracentrifugation into soluble and pellet fractions. Fractions were trypsin digested, labeled with TMT tags and analyzed by tandem mass spectrometry.
(B) Scatter plot shows supernatant-pellet ratio changes in light vs dark samples for one biological replicate (gray dots, N =1777). The proportion of protein in each fraction was estimated from ratios of spectral counts. The shaded region indicates proteins with supernatant fraction >80% in the light and <45% in the dark (dark-demixing). Selected proteins marked in red.
(C) Schematic showing steps catalyzed by dark-demixing enzymes (black rectangles) in central metabolism, including reactions from glycolysis and TCA cycle, pentose phosphate pathway, amino acid biosynthesis, lipid and cell wall synthesis.
