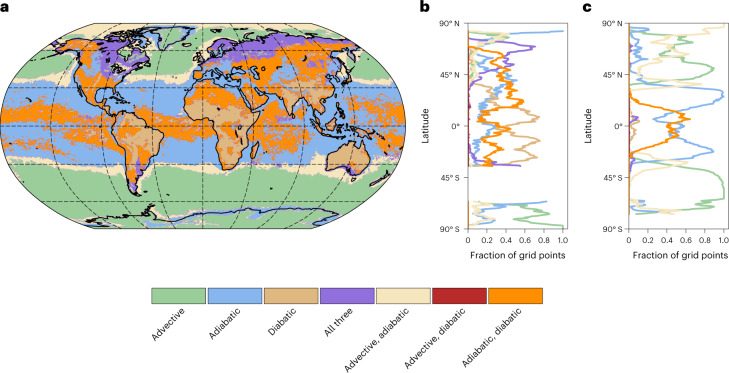
Fig. 3. Classifying grid points according to their TX1day anomaly composition.
a, Green, blue and brown colours indicate regions where one process dominates, whereby a process is deemed dominant if its contribution to the TX1day anomaly is at least twice as large as that of the second most important term. In purple regions, no process dominates, but all three contribute positively to the anomaly. Light brown, red and orange regions also feature no dominant process, but advective T′ and adiabatic T′ are positive (light brown), advective T′ and diabatic T′ are positive (red) or adiabatic T′ and diabatic T′ are positive (orange), with the remaining term being negative. b,c, The fraction of grid points in each category as a function of latitude for land (b) and ocean (c) grid points. The lines are masked for latitudes where less than 10% of the grid points are land (b) or ocean (c) grid points. Dashed grid lines in a are drawn as in Fig. 2.

