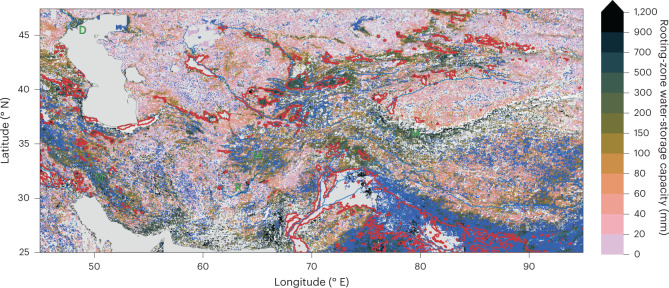
Fig. 2. Rooting-zone water-storage capacity in Central Asia, estimated from SdEF.
Blue areas (flattening) show grid cells where a significant reduction in the slope in EF versus CWD was identified beyond a certain threshold. SdEF values are not calculated for grid cells classified as flattening. Red lines outline major irrigated areas, where the irrigated land area fraction is above 30%41. Information about irrigated areas was used only for mapping here, but is not used for other parts of the analysis. Blank grid cells (white) indicate areas with a sustained imbalance of ET being greater than P. Green letters indicate locations of mountains (M), rivers (R) and delta (D), referred to in the main text. Additional regional maps are provided by Extended Data Figs. 1–3.

