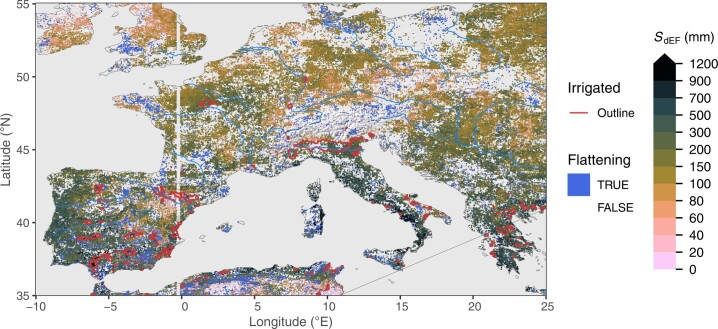
Extended Data Fig. 3. Rooting zone water storage capacity in Europe.
Estimated from the evaporative fraction (SdEF). Blue areas (‘flattening’) show grid cells where a significant reduction in the slope in EF vs. CWD was identified beyond a certain threshold. Red lines show outlines of major irrigated areas, that is, where the irrigated land area fraction is above 30%39. Blank grid cells indicate areas with a sustained imbalance of ET being greater than P.

