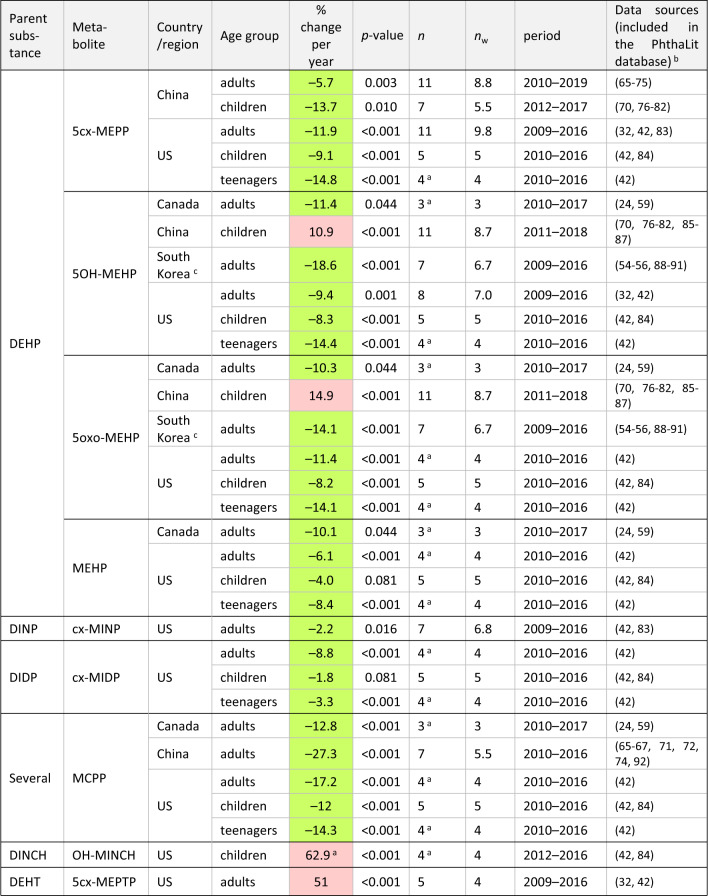
Table 1.
Significant time-trends for metabolites formed from DEHP, high-weight phthalates, DEHT and DINCH.
Green: decreasing trends; red: increasing trends. Only significant trends (p-value <= 0.10) including <33% of censored data, with one or more data points after 2015, for a total period >= 4 years are shown.
n = number of central values aggregated per country, age group, metabolite, year, and Study ID number, per time-trend; nw = number of “full-weight” data per trend, calculated as the sum of the number of aggregated central values (n) multiplied by their weight (Statistical methods, time-trend analysis).
aFor trends with n < 5 (i.e., trends in Canada and some trends in the US), data from national human biomonitoring plans [24, 42] were used both at the earliest and the latest years per trend.
bFor studies where a specific group of population was compared with a control group, data from controls were compiled.
cTrends in Korea were overestimated (see Discussion).

