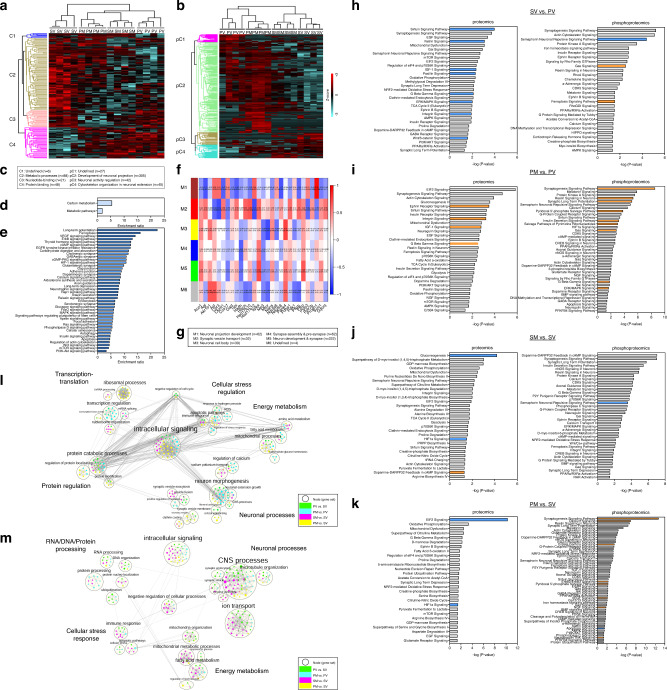
Fig. 2. The effects of mitochondria transplantation on mPFC proteome and phosphorylation events in the four experimental groups (SV, PV, SM and PM) assessed in the adult offspring (PND > 120).
a, b Unsupervised hierarchical clustering of proteins (a) and phosphorylation events (b) resulted in a, 153 ANOVA-significantly altered proteins segregated into four clusters (C1–4), three enriched for metabolic processes (C2; brown), nucleotide-binding (C3; pink) and protein binding (C4; magenta); and in b 423 ANOVA-significantly altered phosphorylation events segregated into four clusters (pC1-4), three enriched for development of neuronal projection (pC2; green), neuronal activity regulation (pC3; brown) and cytoskeleton organization in neuronal extension (pC4; turquoise). Distance estimation between samples’ proteins, assessed by Euclidean distances, showed that SV clustered separately from all other three groups, still PM profile distance was closer to SV than that of SM and PV. Scale bar: Z-scores −3 to +3. c Legend of dendrogram clusters of proteome (C1–4) and phosphoproteome (pC1–4) of the hierarchical clustering. Dendrogram cluster enrichment was performed using STRING analysis and defined by GO terms. d, e Over-representation (ORA) analysis of ANOVA-significant proteins (d) and phosphoproteins (e) yielded significant functional enrichments for carbon metabolic metabolism and neuronal signaling pathways, respectively. f Weighted gene correlation network analysis (WGCNA) of significant proteins enriched for metabolic pathways (traits) and ANOVA-significant phosphoproteins (modules; M1-M6) showed significant bi-weight mid-correlations (r > |0.5|, P ≤ 0.05) between 90% of the proteins and 1–3 phospho-modules. Each row corresponds to a module, each column to a trait; each cell contains the corresponding correlation and its P value. The table is color-coded by correlation according to the color legend (Pearson’s r). g Legend of the phosphoproteins modules (M1-M6), and phosphoprotein number in brackets, mainly enriched for neuronal and synaptic morphology and development by STRING analysis. h, i, j, k Canonical pathway enrichment analysis of significant proteins and phosphorylation events differentially regulated between SV and PV (h), PM and PV (i), SM and SV (j), and PM and SM (k) groups in adulthood (PND 120), using Ingenuity Pathway Analysis (IPA). Prediction of activation was determined by Z-scores: activation (orange) - Z-score > 2; inhibition (blue) - Z-score < −2; undefined direction (gray). Enrichment significance: –log (P value) > 1.3 (red line = threshold of significance). l, m Enrichment maps of the proteome (l) and phosphoproteome (m) depicting the distribution of core functional cellular processes differentially enriched in the four group comparisons (PV vs. SV, PM vs. PV, SM vs. SV and PM vs. SV), using Gene-Set Enrichment Analysis (GSEA) and Cytoscape visualization. Each node (small circle) represents a distinct pathway; edges (gray lines) represent the number of genes overlapping between two pathways, determined by the coefficient of similarity. (a–m) N = 4 rats/group.

