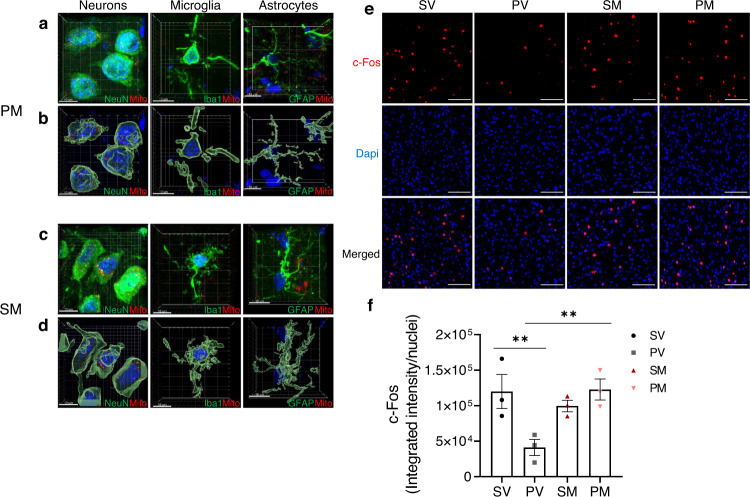
Fig. 3. Mitochondria cell entrance and neuronal activation.
a–d Representative confocal images of MitoTracker-stained mitochondria (red) 3 h after transplantation in the mPFC of PM (a, b) and SM (c, d) rats. a, c 3D presentations of integrated confocal scans and b, d Imaris modelizations of cells depicted in (a) and (c). Neurons were stained with NeuN (green), microglia with Iba1 (green) and astrocytes with GFAP (green). Scale bar: 10 µm. e Representative images of immunofluorescence staining of c-Fos, the early nuclear marker for neuronal activation, in the mPFC of the four experimental groups at two days after transplantation. Scale bar: 100 µm. f Quantification of c-Fos integrated intensity at two days after transplantation. One-way ANOVA showed a significant difference between groups (F(3,8) = 5.81, P = 0.020). In PM rats, mitochondria enhanced the reduced c-Fos activity of PV to normal levels (PV vs. SV, P < 0.031; PM vs. PV, P < 0.026). c-Fos activation was measured as c-Fos fluorescence intensity (red) co-localized with Dapi (blue) divided by the number of total nuclei. N = 3 rats/group; 3–6 sections/rat; N = 12 total rats/time point. All values are means ± s.e.m. **P < 0.03.

