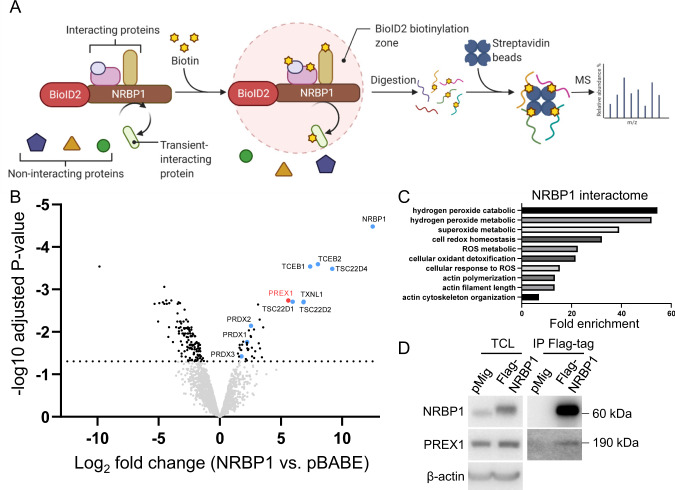
Fig. 5. Characterization of the NRBP1 interactome by BioID-MS.
A Schematic workflow of BioID-MS. A promiscuous biotin ligase (BirA*) is fused to the protein of interest (the ‘bait’ protein, here NRBP1) and the fusion protein expressed in cells. Addition of excess biotin results in biotinylation of endogenous proteins in the proximity of the bait. After affinity pulldown using streptavidin agarose beads, the biotinylated proteins are identified by MS. The figure was adapted from “BioID Assay”, using BioRender.com (2022). B The NRBP1 interactome in TNBC. A volcano plot representation of the MS dataset with cut-off of adjusted p-value ≤ 0.05 and Log2 fold change ≥ 1. Data are generated from n = 3 independent experiments. Labelled proteins represent previously-identified interactors or novel ones associated with cytoskeletal or redox regulation. C Functional pathways associated with NRBP1 interactors. The graph shows the top ten functions of interactors identified by “Metascape” software. D Confirmation of NRBP1-P-Rex1 interaction. Flag-tagged NRBP1 or vector control were transfected into MFM-223 cells. Total cell lysate (TCL) and Flag IPs were subjected to Western blotting as indicated.

