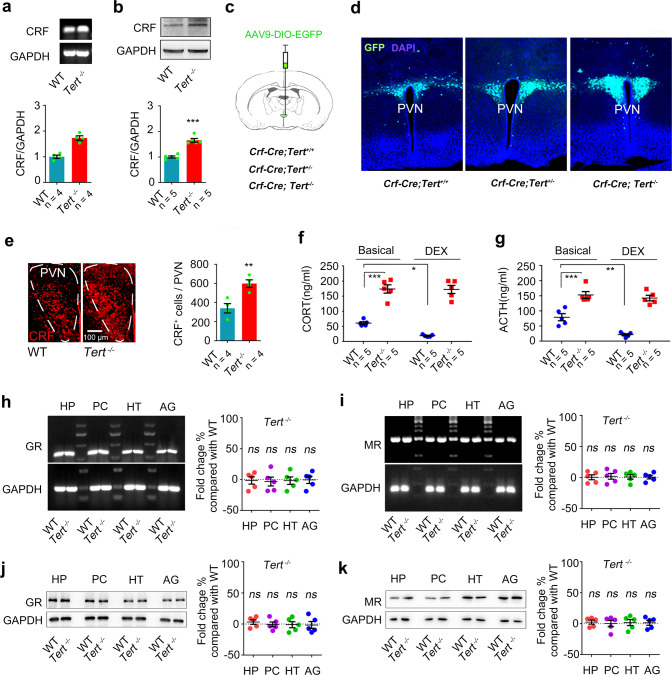
Fig. 1. Hyperactivity of the HPA axis in Tert knockout mice without GR and MR deficiency.
a RT-PCR showing the levels of CRF and GAPDH mRNA in the hypothalamus of Tert−/− and WT mice. n = 4. Student’s t test. b Western blot showing the levels of CRF and GAPDH protein in the hypothalamus of Tert−/− and WT mice. n = 5. Student’s t test. c, d Experimental design and representative images showing GFP+ cells in the PVN of Crf-Cre; Tert+/+, Crf-Cre; Tert+/−, or Crf-Cre; Tert−/− mice. n = 3. e Immunofluorescence showing the number of CRF+ cells in the PVN of Tert−/− and WT mice. n = 4. Student’s t test. f The concentrations of CORT in the plasma of Tert−/− and WT mice treatment with DEX or vehicle. n = 5. Two-way ANOVA. g The concentrations of ACTH in the plasma of Tert−/− and WT mice treatment with DEX or vehicle. n = 5. Two-way ANOVA. h, i RT-PCR showing the levels of GR, MR, and GAPDH mRNA in the HP, PC, HT, and AG of Tert−/− and WT mice. n = 5. j, k Western blot showing the levels of GR, MR, and GAPDH protein in the HP, PC, HT, and AG of Tert−/− and WT mice. n = 5. HP Hippocampus, PC Prefrontal cortex, HT Hypothalamus, AG Amygdala. *P < 0.05, **P < 0.01, and ***P < 0.001, ns indicates no significant difference. Error bars indicate s.e.m.

