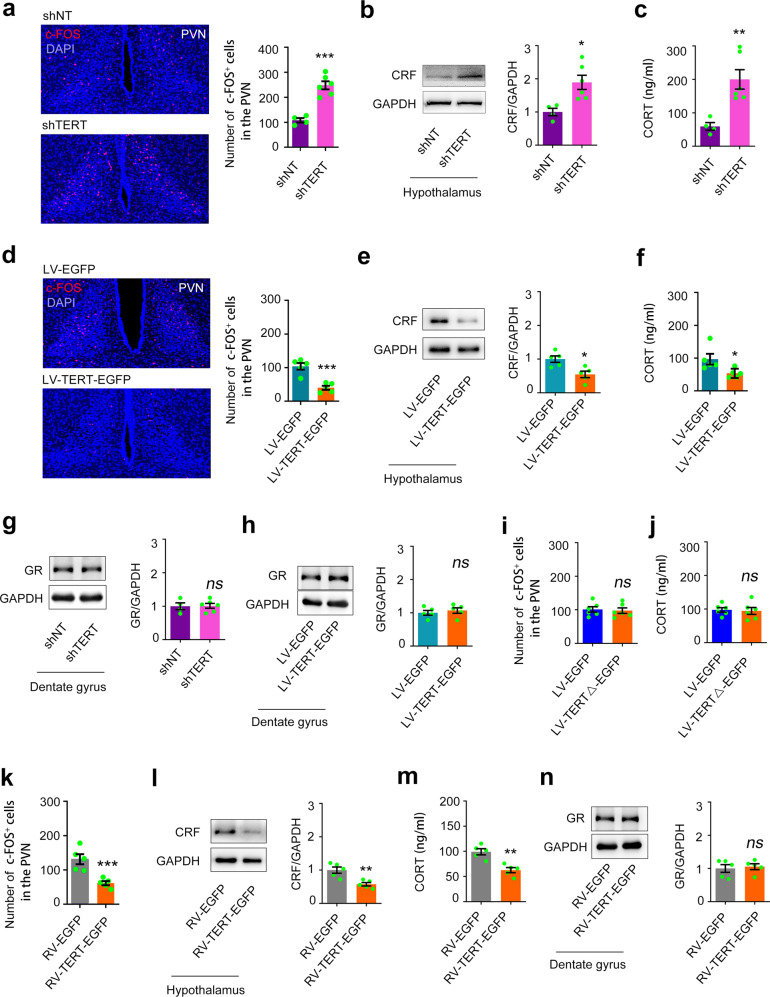
Fig. 3. Telomerase catalytic activity is involved in the modulation of the HPA axis activity.
The number of c-FOS+ cells in the PVN (a), the expression of CRF and GAPDH in the hypothalamus (b), and the concentration of CORT in the plasma (c), in C57BL/6 mice 2 months after injection of 1 μl of shTERT or shNT into the bilateral DGs. n = 4–6. Student’s t test. The number of c-FOS+ cells in the PVN (d), the expression of CRF and GAPDH in the hypothalamus (e), and the concentration of CORT in the plasma (f), in mice 2 months after injection of 1 μl of LV-TERT-EGFP or LV-EGFP into the bilateral DGs. n = 5. Student’s t test. The expression of GR in the DG 2 months after shTERT (g) or LV-TERT-EGFP infection (h). n = 4–6. Student’s t test. The number of c-FOS+ cells in the PVN (i) and the concentration of CORT in the plasma (j) in mice 2 months after injection of 1 μl of LV-TERTΔ-EGFP or LV-EGFP into the bilateral DGs. n = 6. Student’s t test. The number of c-FOS+ cells in the PVN (k), the expression of CRF and GAPDH in the hypothalamus (l), the concentration of CORT in the plasma (m), and the expression of GR in the DG (n), in mice 2 months after injection of 1 μl of RV-TERT-EGFP or RV-EGFP into the bilateral DGs. n = 5. Student’s t test. *P < 0.05, **P < 0.01, and ***P < 0.001, ns indicates no significant difference. Error bars indicate s.e.m.

