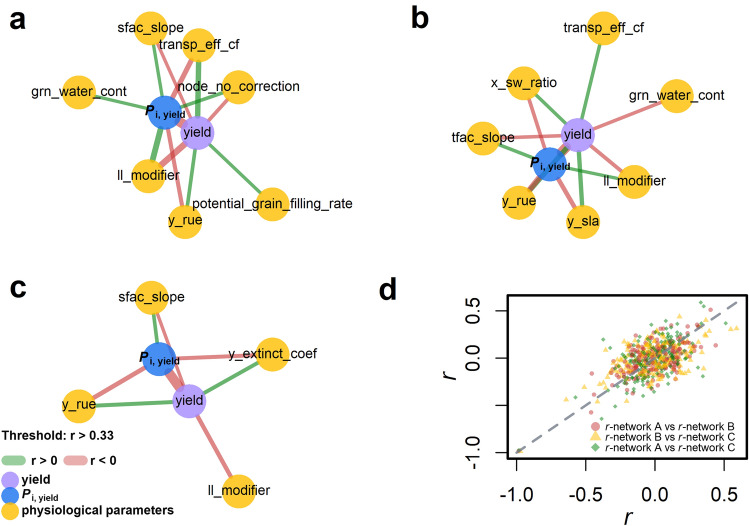
Fig. 3.
Three r-network of yield, Pi,yield and 90 physiological parameters from three different sampled populations of genotype (a–c, Ngen = 100) grown under 9000 environments (SPE = 1). Nodes (circle) represent mean yield (purple), Pi,yield (blue) or physiological parameters (yellow). Correlation between two nodes presents as a line (edge), which’s width is proportional to the absolute value of Pearson correlation coefficient (|r|). Green and red lines mark positive and negative r value, respectively. Nodes are shown with connected edge when |r| > 0.33. d Comparison of r-vector (Supplementary Fig. S2c) from a–c. Colour and shape stand for the combination of networks. Grey dashed line stands for the 1:1 line. Description of physiological parameters: water content of grain (grn_water_cont), number of grains that are set depending on the stem dry weight (grain_per_gram_stem), efficiency of roots to extract soil water (ll_modifier), rate of node senescence on main stem (node_sen_rate), potential rate of grain growth at grain filling (potential_grain_filling_rate), sensitivity to photoperiod (photop_sens), soil water effect on biomass accumulation (sfac_slope), transpiration efficient (transp_eff_cf), temperature effect on biomass accumulation (tfac_slope), water availability affecting the stress factor for root depth growth (x_sw_ratio), fraction of dry matter allocated to rachis for specific stages (y_frac_leaf), radiation use efficiency (y_rue), potential leaf specific area (y_sla), Extinction coefficient of green leaves as a response to row spacing (y_extinct_coef) (colour figure online)

