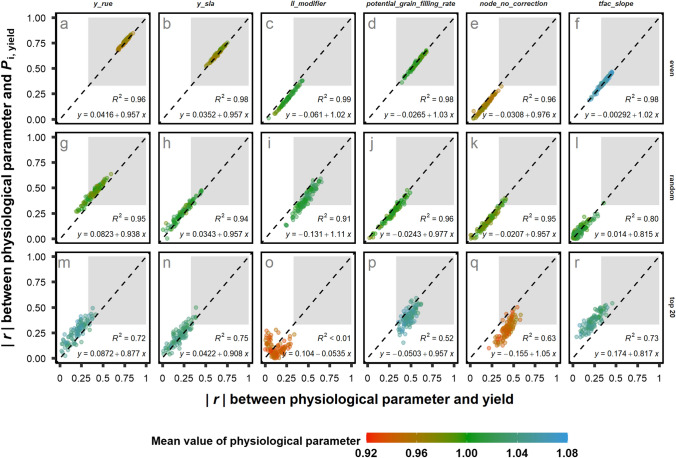
Fig. 4.
Scatterplots of |r| of six physiological parameters to Pi,yield versus |r| to yield from three selection methods (“random”, “even” and “top 20”) of 100 genotypes (Ngen = 100, SPG = 100) from 9000 environments (Nenv = 9000, SPE = 1). Each point represents a SPG and colour of the point represents the mean values (normalized to one by the parameter values of calibrated cultivar Hartog) of physiological parameters from 100 genotypes in one SPG. The “even” sampling method divides population into ten groups based on mean yield value, with ten virtual genotypes randomly selected in each yield group. The “top 20” method randomly selects virtual genotypes with mean yield above 80th percentile of the whole population. Grey rectangle area stands for the region of |r|> 0.33. Black dashed line stands for 1:1 line. Meaning of the physiological parameters (in italic) follow the order (left to right) in the figure: radiation use efficiency (y_rue), potential leaf specific area (y_sla), efficiency of roots to extract soil water (ll_modifier), potential grain growth rate at grain filling (potential_grain_filling_rate), number of growing leaves in the sheath (node_no_correction) and temperature effect on biomass accumulation (tfac_slope)

