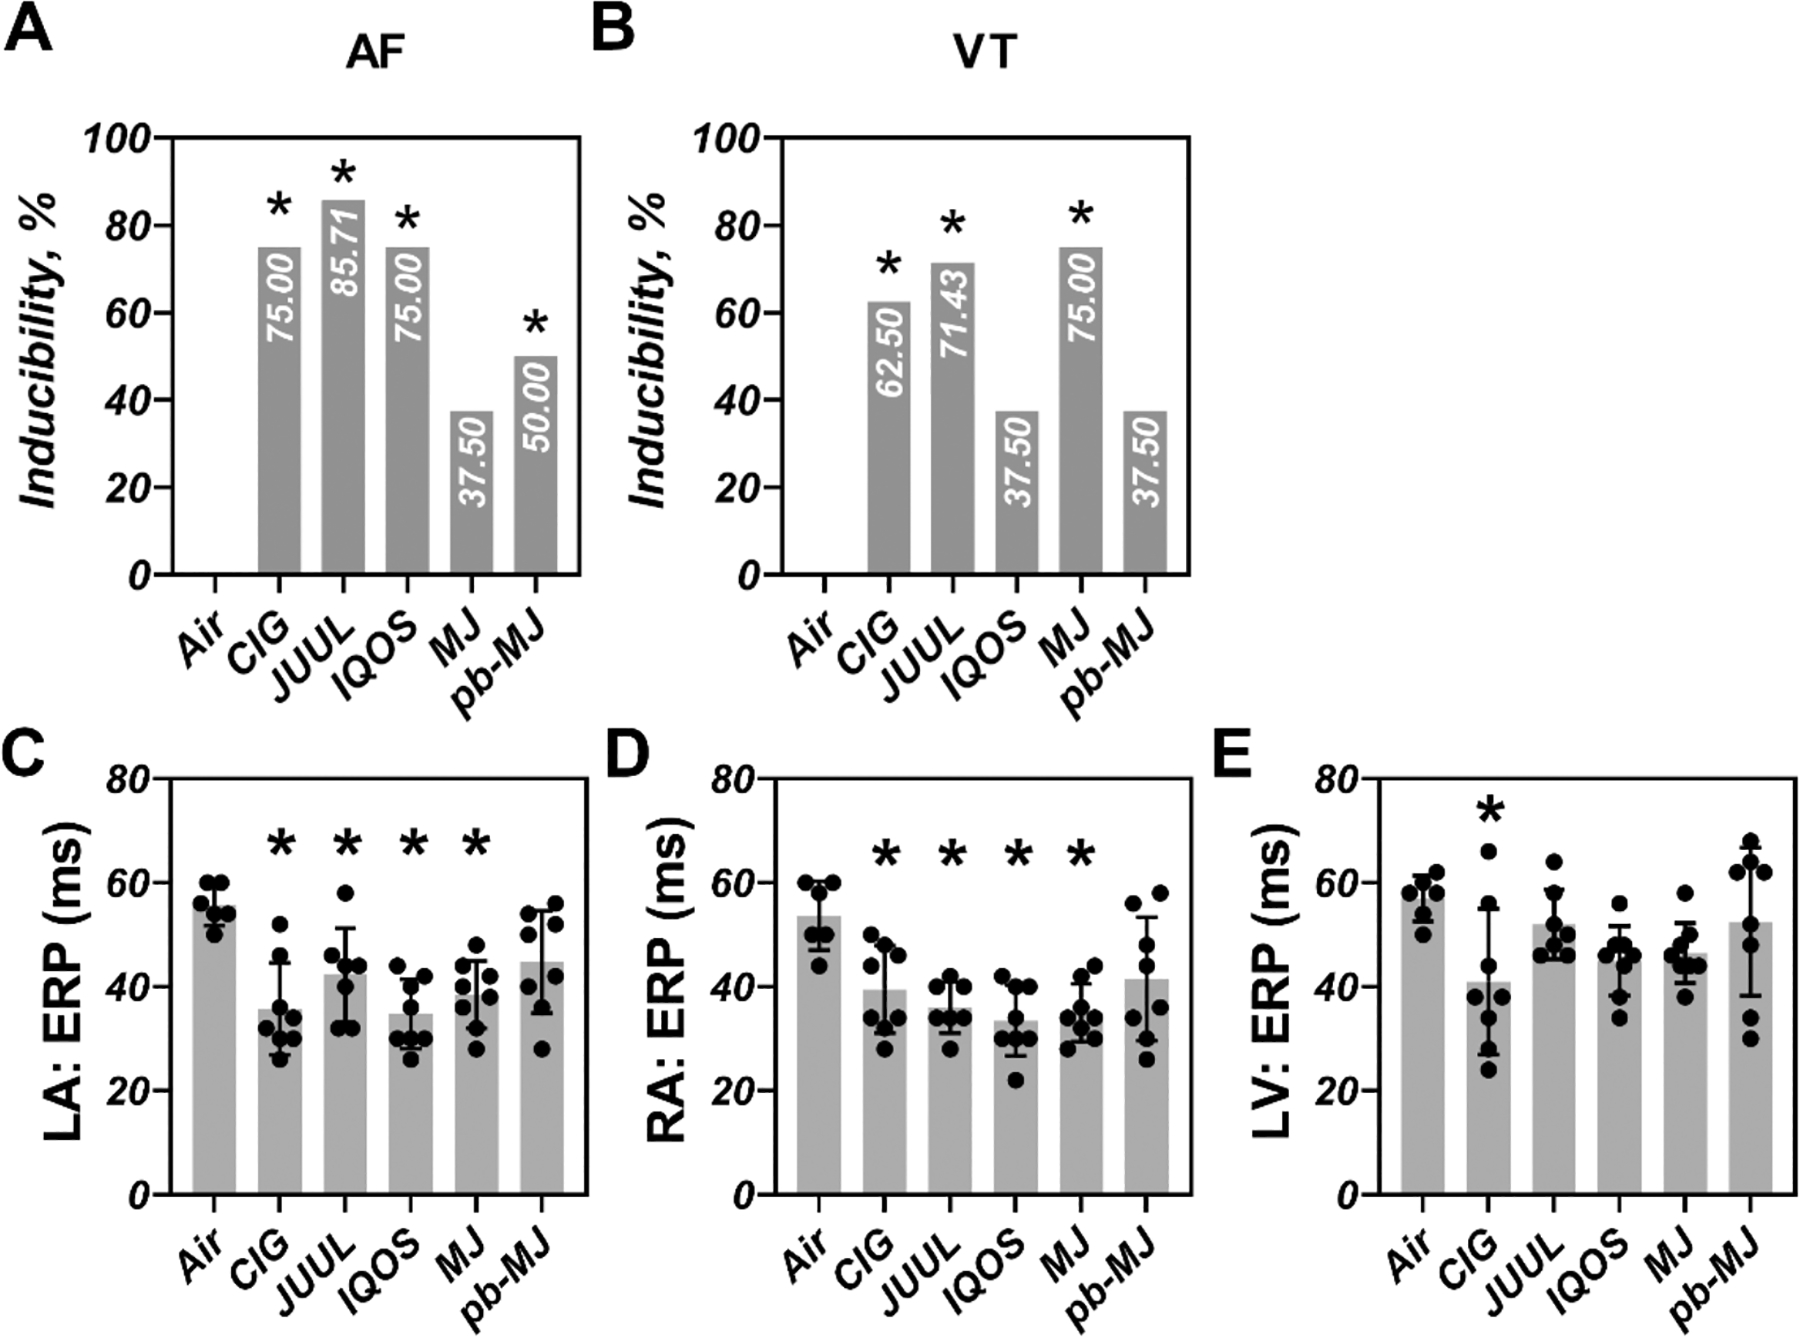
Fig. 4. Chronic smoking or vaping increased the susceptibility to atrial fibrillation (AF) and ventricular tachycardias (VT) with shortened effective refractory period (ERP).

A-B. inducibilities of AF and VT. C-E. ERP. Pearson χ2 with a Bonferroni post hoc test or one-way ANOVA followed by Tukey’s multiple comparisons test was used to do statistical analysis. *P<.05, compared to Air; N = 6, 8, 7, 8, 8, and 8 in Air, CIG, JUUL, IQOS, MJ, and pb-MJ respectively. Of note, in panel A, P=.091, Air compared to MJ; in panel B, P=.091, Air compared to IQOS and pb-MJ; in panel C, P=.13, Air compared to pb-MJ; in panel D, P=.07, Air compared to pb-MJ; in panel E, P=.20, CIG compared to pb-MJ.
