
Fig. 6. Fibrosis and fibrotic biomarkers.
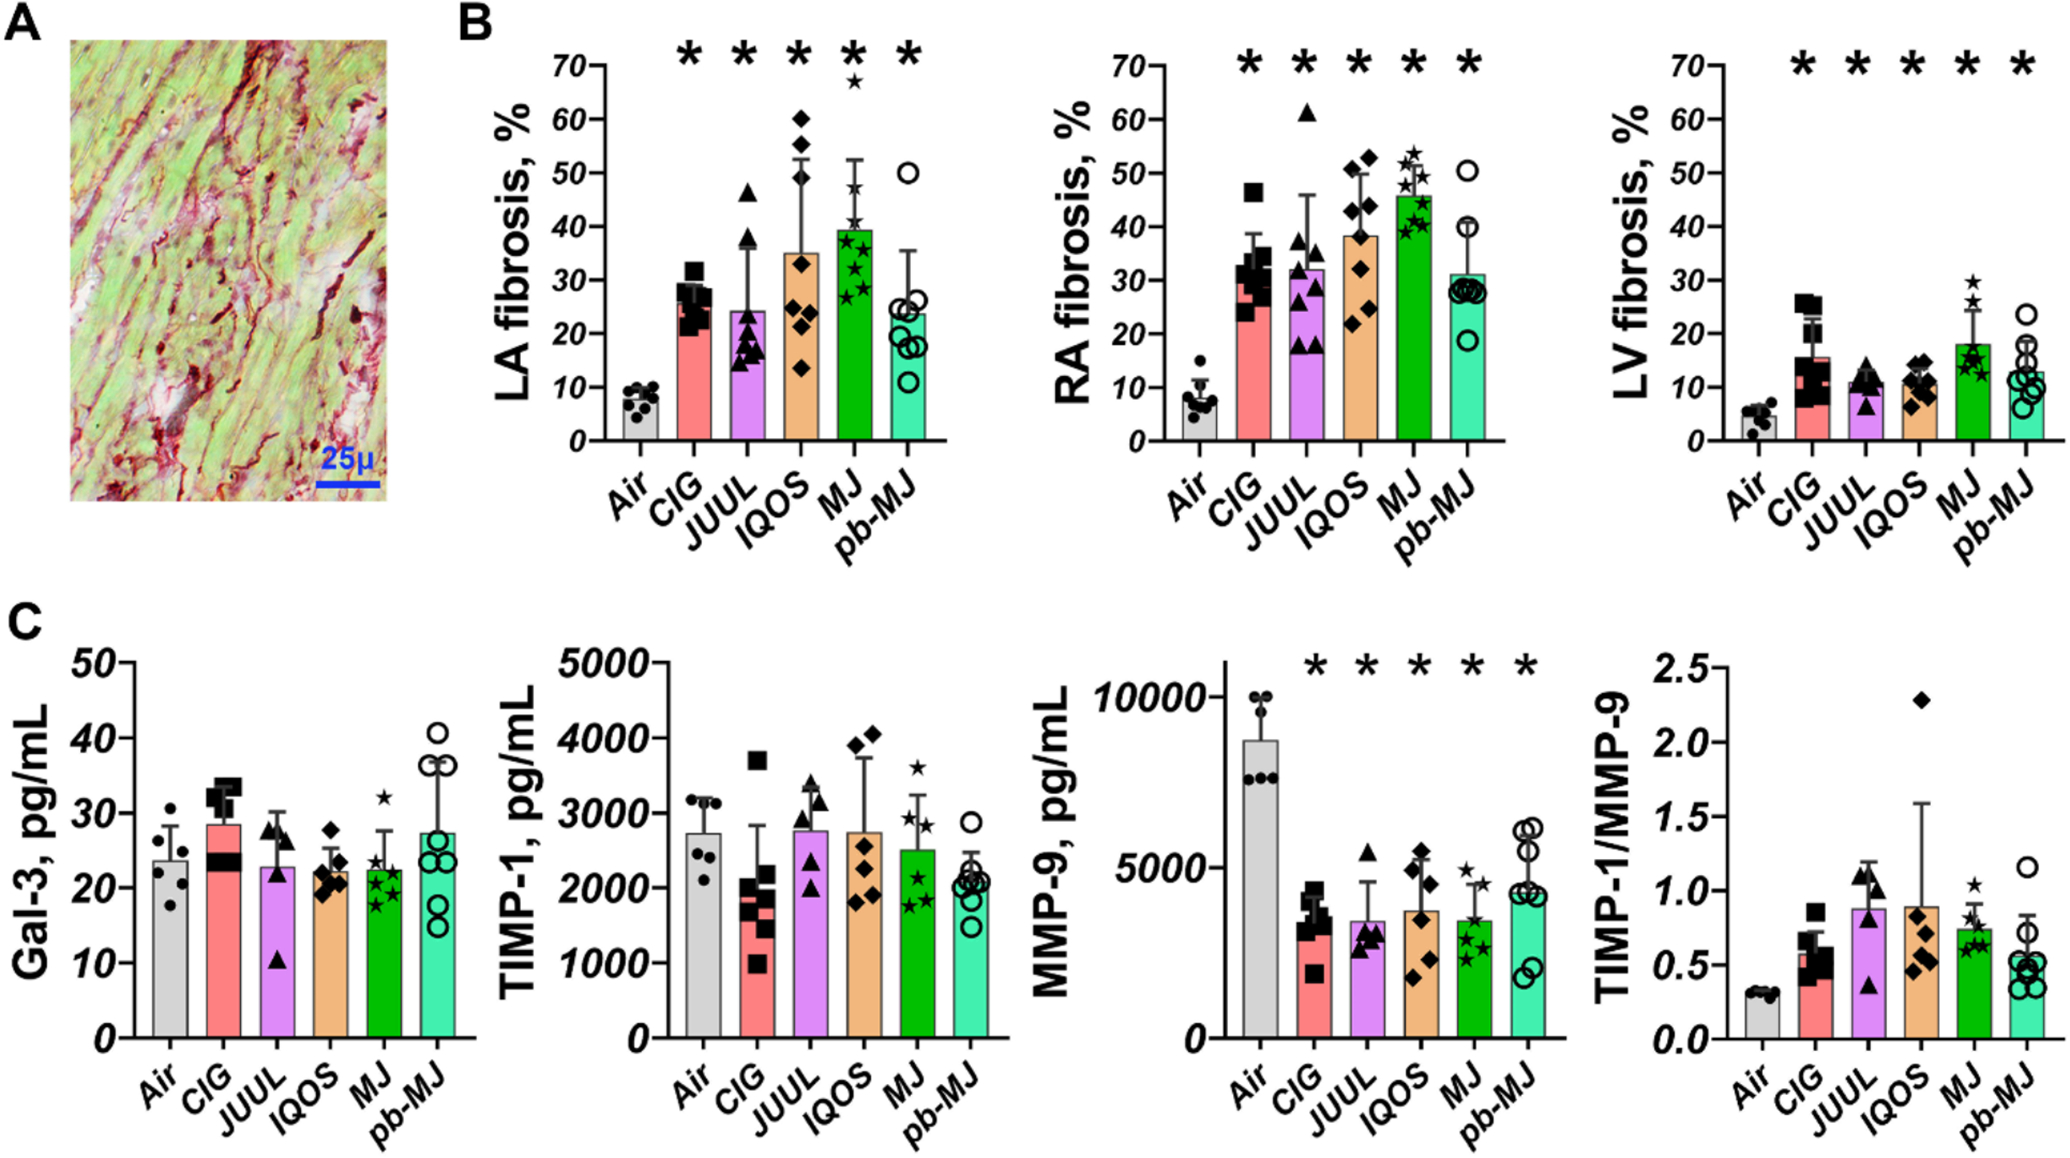
A. Sirius red staining is shown for example. B. Increased cardiac fibrosis in non-air groups. C. ELISA assays showed that there were no significant changes in Gal-3 and TIMP1; However, MMP-9 was significantly decreased in non-air groups and the ratio of TIMP1 to MMP-9 was elevated in non-air conditions. Data were expressed as mean ± SD and analyzed by one way ANOVA followed by Tukey’s multiple comparisons test. *P<.05, compared to Air. N = 8 each group for tissue fibrosis staining; and N = 6, 7, 5, 6, 6, and 8 in Air, CIG, JUUL, IQOS, MJ, and pb-MJ respectively for ELISA. Of note, in panel C, for Gal-3, P=.99, Air compared to CIG and pb-MJ. For TIMP-1, P=.30 and .71, Air compared to CIG and PB-MJ respectively. For TIMP1/MMP9, Air compared to CIG, JUUL, IQOS, MJ and PB-MJ P=.76, .11, .07, .34, and .76, respectively.