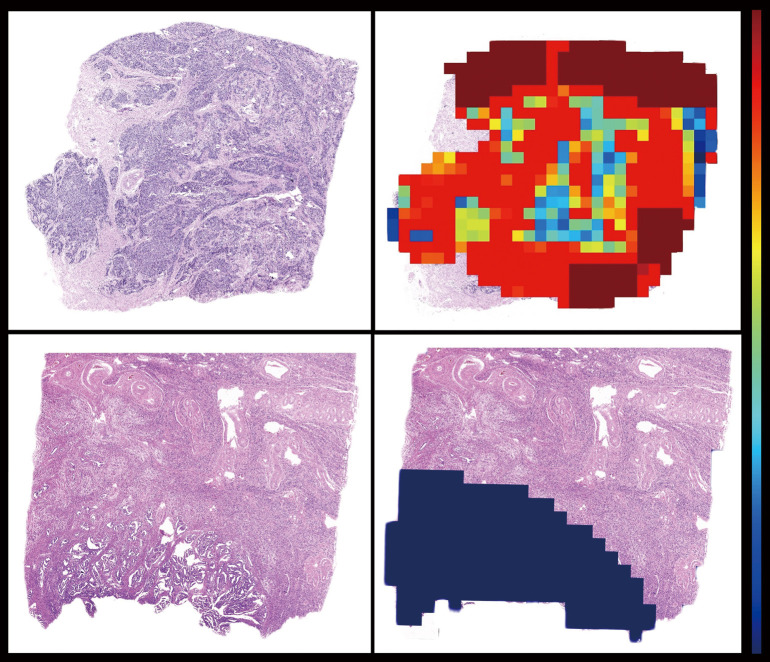
Figure 7.
Visualization of the LNM probability of the subregions (tiles) of sample WSIs based on HE-stained histopathological images (×10). The example of LNM probability heatmaps showing the probability distribution on WSIs. The colors reflect LNM probabilities. LNM, lymph node metastasis; WSI, whole slide image; HE, hematoxylin and eosin.

