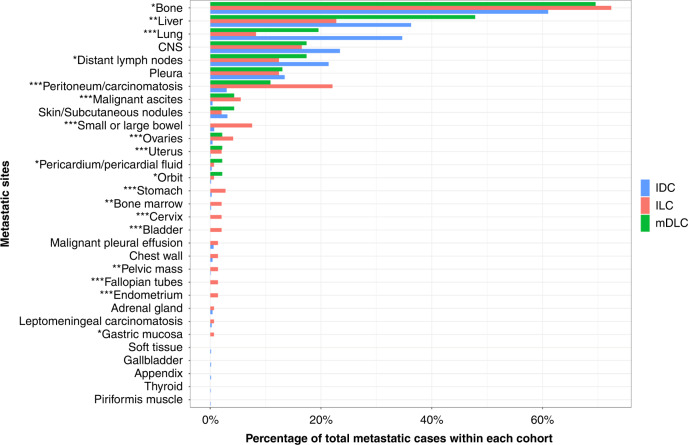
Fig. 4. Distribution of metastatic spread compared between mDLC, ILC, and IDC.
x axis includes sites of metastatic disease. y axis presents percentage of total metastatic cases within mDLC, ILC, and IDC cohorts. * indicates the significance among three subgroups (*p value < 0.1, **p value < 0.01 and ***p value < 0.001).

