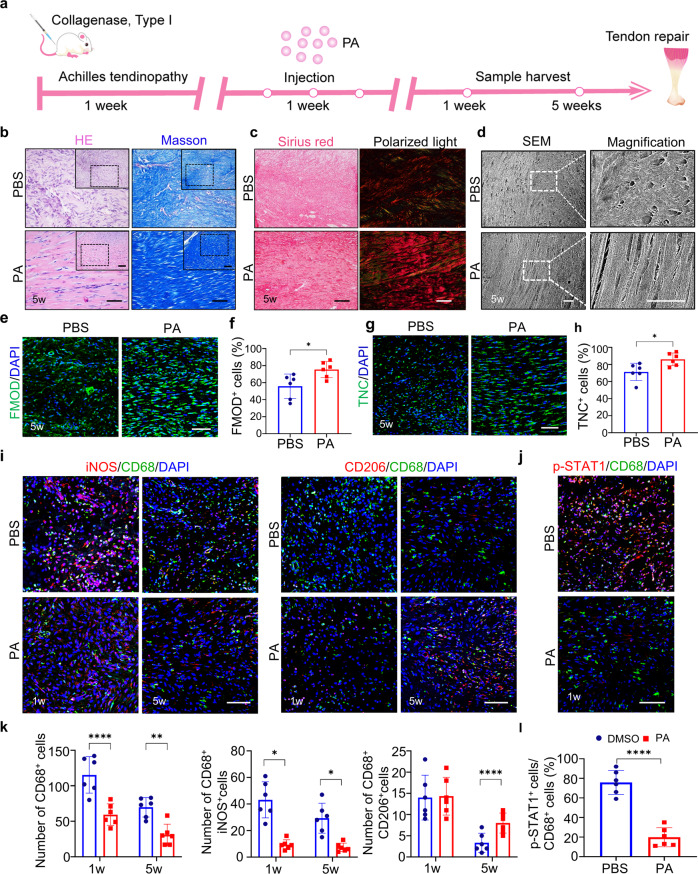
Fig. 2. PA alleviates collagenase-induced tendinopathy by inhibiting inflammatory response.
a Schematic illustration of the experimental animal procedure. b HE and Masson’s trichrome staining of neo-tendons from PBS and PA groups at 5 weeks. Scale bar, 100 μm. c Representative Sirius red staining and polarized light images showing the collagen type in neo-tendons from PBS and PA groups at 5 weeks. (Green, type III collagen; red, type I collagen). Scale bar, 100 μm. d SEM of collagen pattern of newly-formed tendon collagen fibrils in each group at 5 weeks. Scale bar, 40 μm. e Immunofluorescence staining of tenogenic marker FMOD in neo-tendons from PBS and PA groups at 5 weeks. Scale bar, 100 μm. f Semi-quantification of e. g Immunofluorescence staining of tenogenic marker TNC in neo-tendons from PBS and PA groups at 5 weeks. Scale bar, 100 μm. h Semi-quantification of (g). i Co-immunofluorescence staining of iNOS and CD68, and CD206 and CD68 in neo-tendons from PBS and PA-treated groups at 1 week and 5 weeks. Scale bar, 100 μm. j Immunofluorescence staining of p-STAT1 and CD68 in 1w neo-tendons from PBS and PA-treated groups at 1 week. Scale bar, 100 μm. k Semi-quantification of total CD68+, iNOS+CD68+ and CD206+CD68+ cells in (i). l Semi-quantification of (j). Data are presented as mean ± SD. *p < 0.05, **p < 0.01 and ****p < 0.0001, n = 6.

