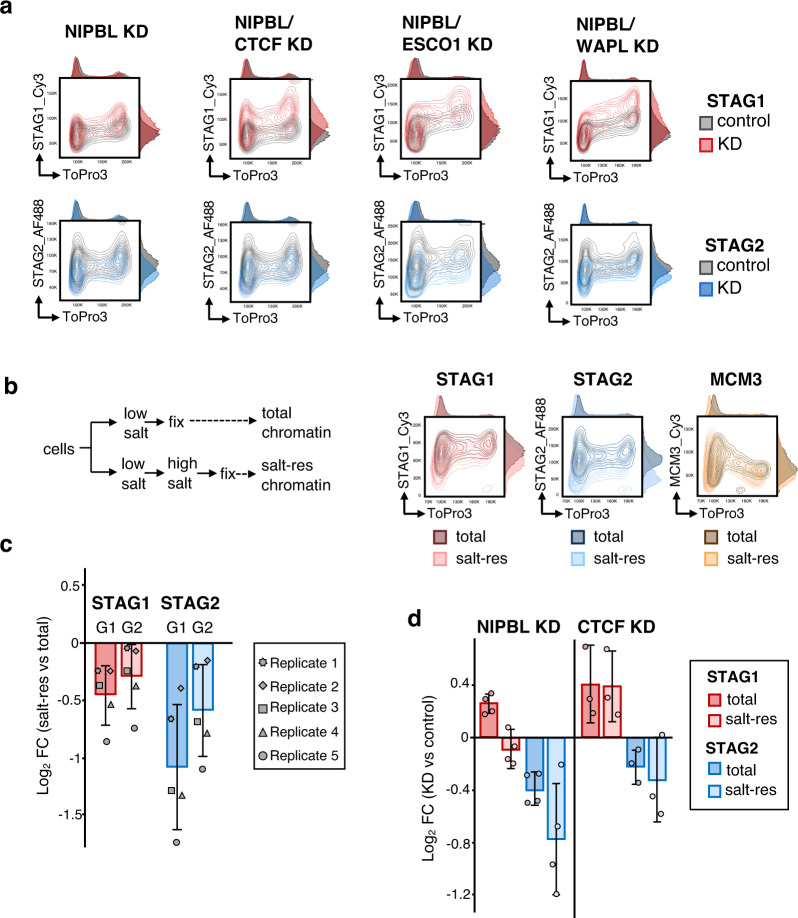
Fig. 2. Effect of cohesin regulators on the response of cohesin variants to NIPBL KD.
a Representative flow cytometry contour plots for chromatin-bound STAG1 and STAG2 in control (gray plots) and KD (colored plots) HeLa cells. For each double KD condition, a single KD condition was also analyzed (see Supplementary Fig. 3). The NIPBL KD plot shown corresponds to the experiment co-depleting NIPBL and CTCF. Experiments were performed three times with similar results. b Left, scheme of the experiment. Right, flow cytometry contour plots comparing total and salt-resistant chromatin-bound levels of STAG1, STAG2 and MCM3. c Quantification of salt-resistant vs. total chromatin-bound levels of STAG1 and STAG2 in G1 and G2 (n = 5 experiments). The graph shows mean and standard deviation (SD) of the log2 fold change (log2FC) of median antibody intensity (salt res vs. total). d Changes in total and salt-resistant chromatin-bound levels of STAG1 and STAG2 in G1 cells after NIPBL KD (n = 4 experiments) or CTCF KD (n = 3 experiments). The graph shows mean and SD of the log2FC of median antibody intensity (KD vs. control).

