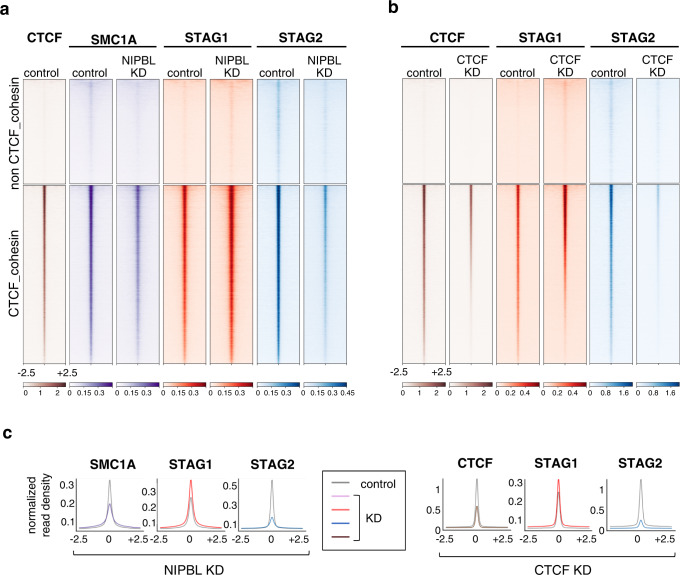
Fig. 4. Cohesin-STAG1 accumulates at CTCF sites in NIPBL KD cells.
a Distribution of three cohesin subunits in control and NIPBL KD MCF10A cells. Reads from calibrated ChIP-seq are plotted in a 5-kb window centered in the summits of cohesin positions with and without CTCF (24,912 and 14,607 positions, respectively). Information on replicates and additional datasets used in Supplementary Table 4. b Distribution of CTCF, STAG1 and STAG2 in control and CTCF KD MCF10A cells, as in a. For a replicate experiment and additional analyses see Supplementary Fig. 5. c Normalized read density plots for cohesin subunits ±2.5 kb of the summit in the different KD conditions from the heatmaps above.

