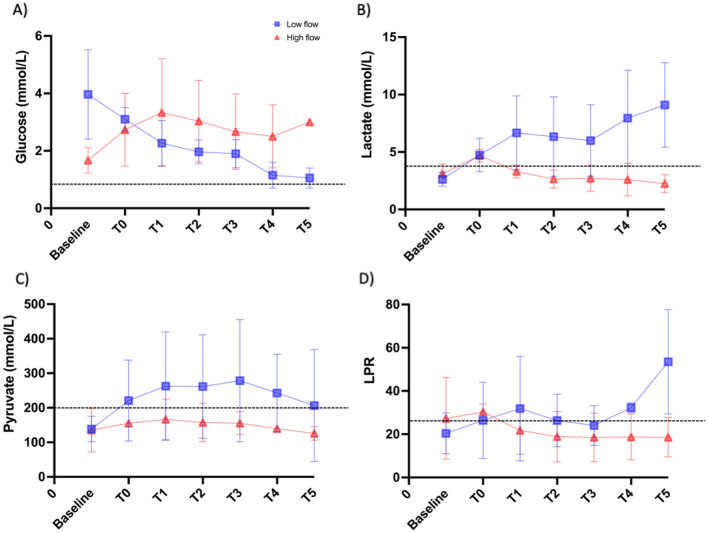
Figure 6.
cerebral microdialysis values at different timepoints for each study group. Legend: Concentrations of (A) glucose (mmol L−1), (B) lactate (mmol L−1), and (C) pyruvate (mmol L−1), and (D) lactate-pyruvate ratio (LPR). Red lines represent results from the “high flow” group and blue lines from the “low flow” group. Dotted lines represent pathological thresholds as defined by the 2014 Consensus statement from International Microdialysis Forum8.

