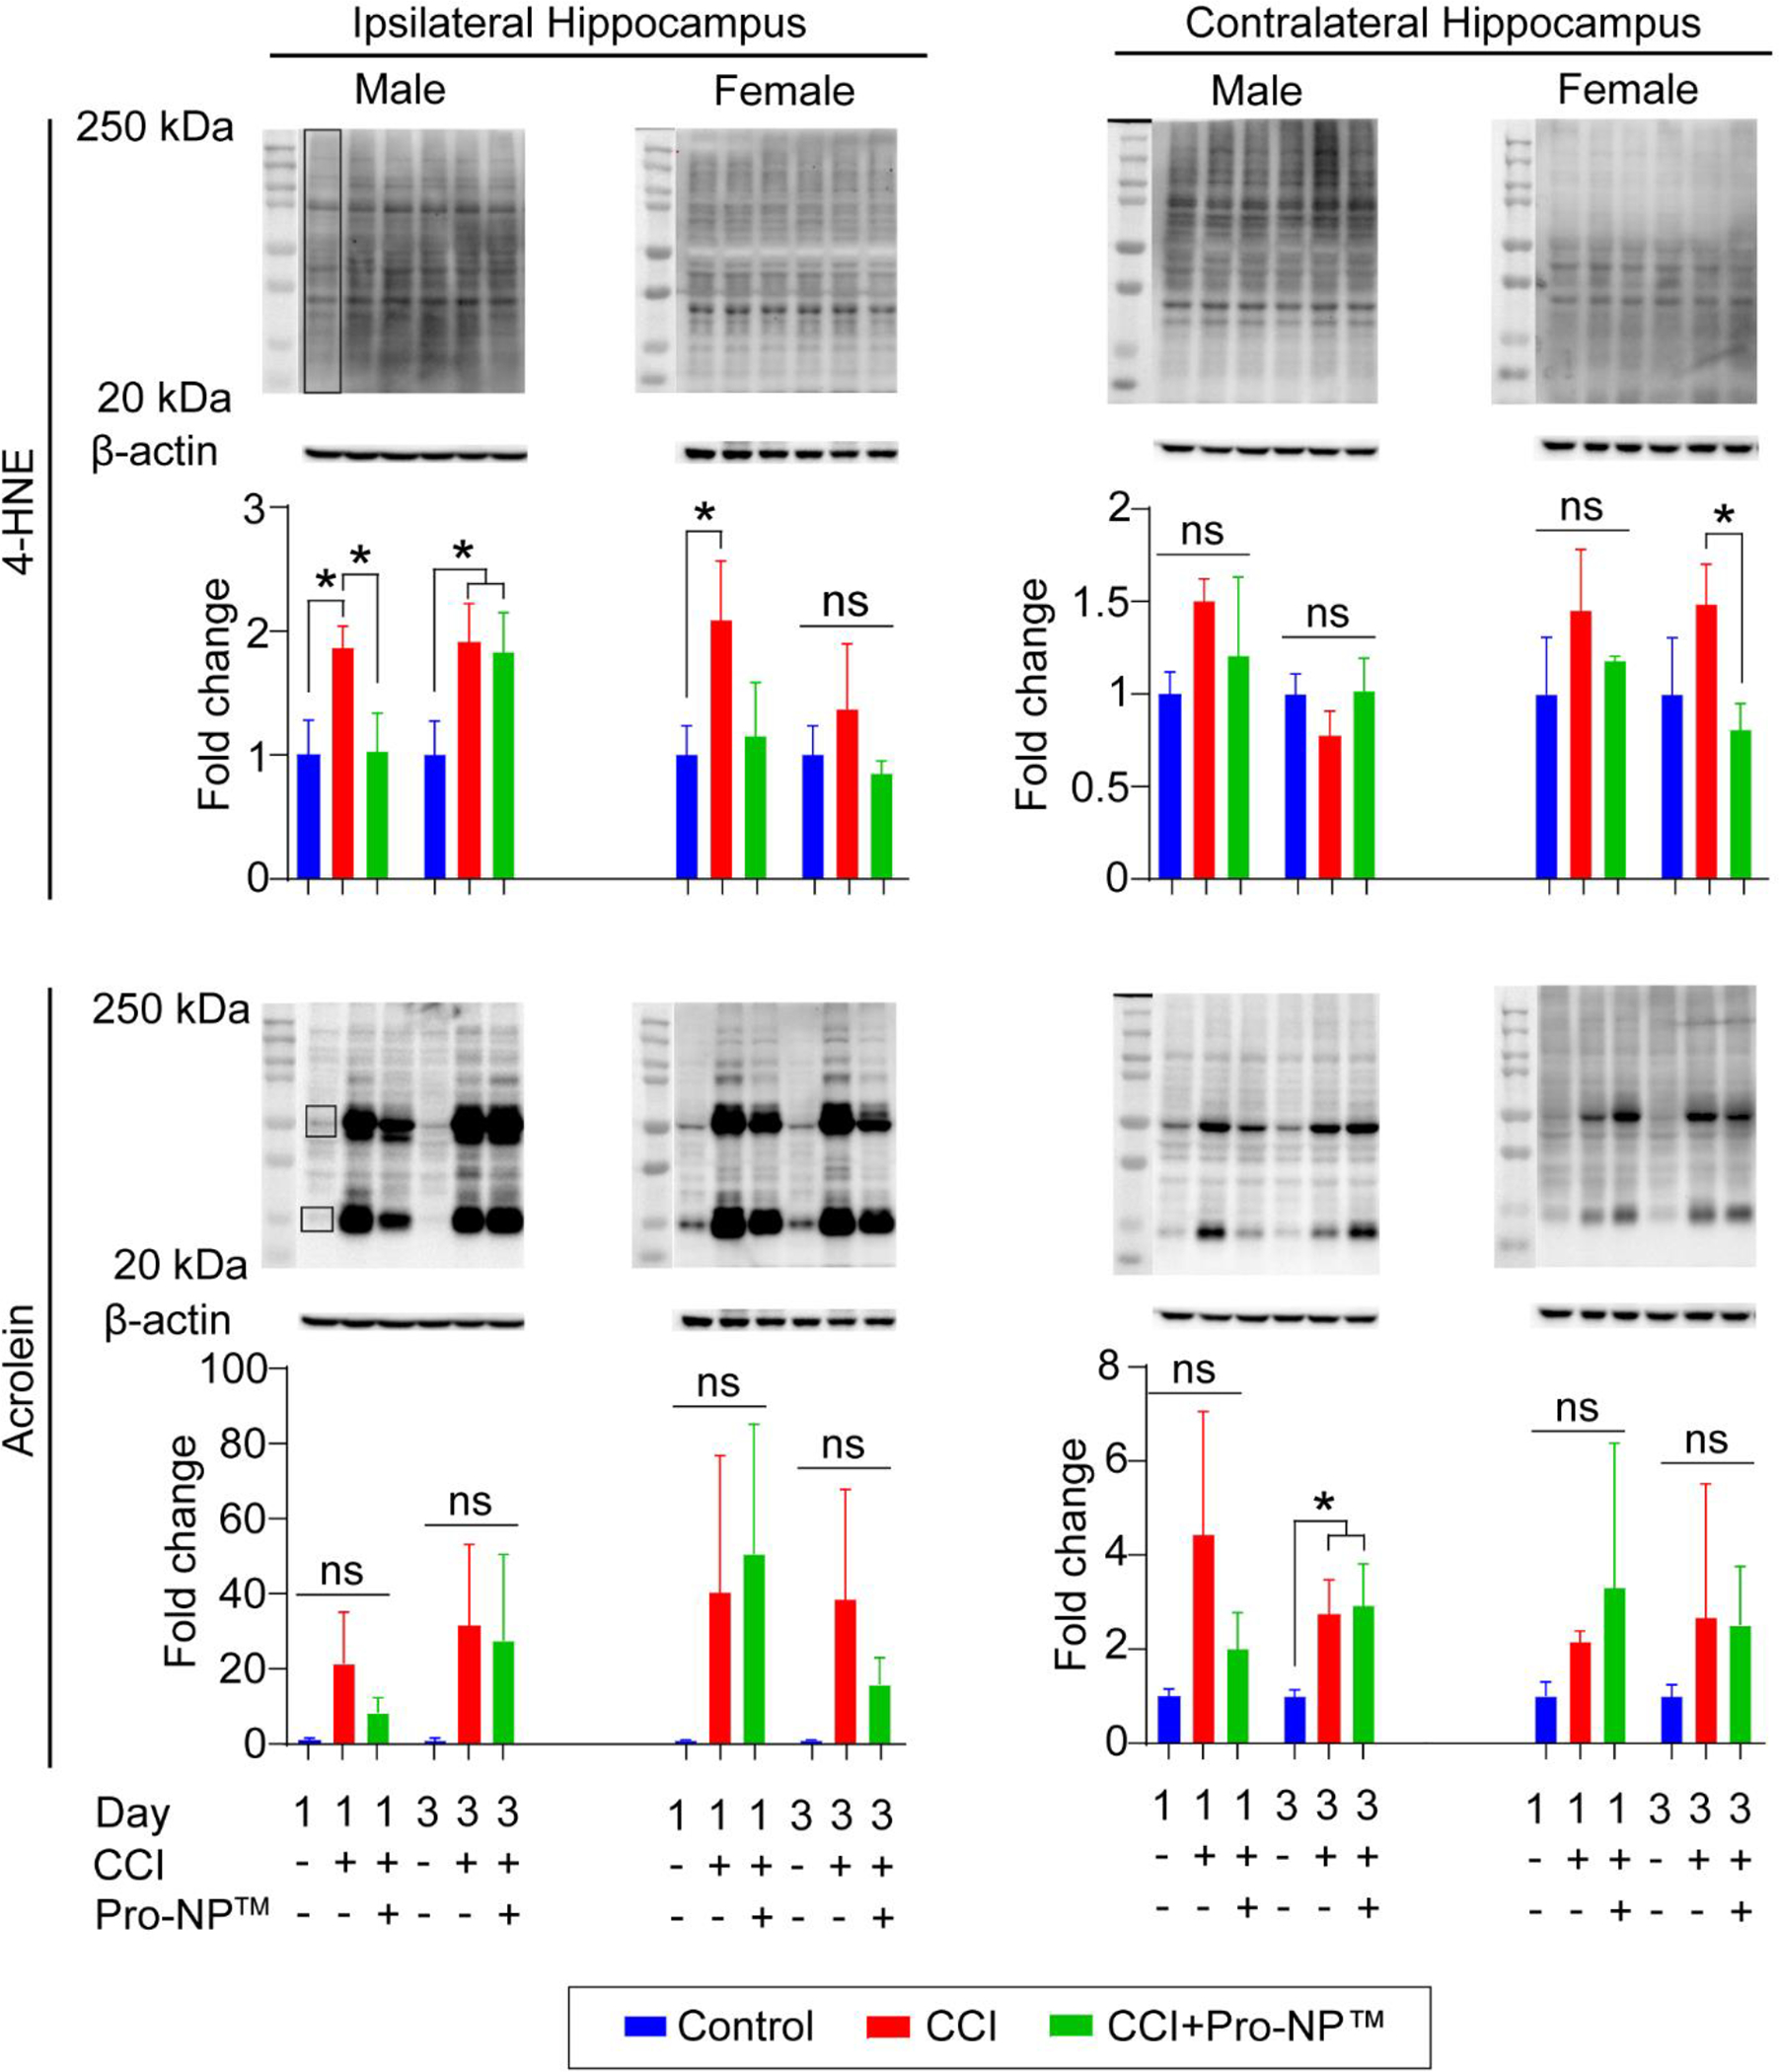
Figure 3.

Analysis of carbonyl stress in the hippocampus. Western blot of 4-HNE and acrolein in the ipsi- and contralateral hippocampus for male and female mice at 1 and 3 d post-injury. The boxed area represents the ROI for quantification of 4-HNE and acrolein in the ipsilateral and contralateral hippocampus normalized to control mice. Data are shown as mean ± SD with n = 3 for each treatment group. ns indicates an insignificant different between treatment group. * indicates a significant different with p < 0.05, as determined by one-way ANOVA and Tukey’s post hoc test.
