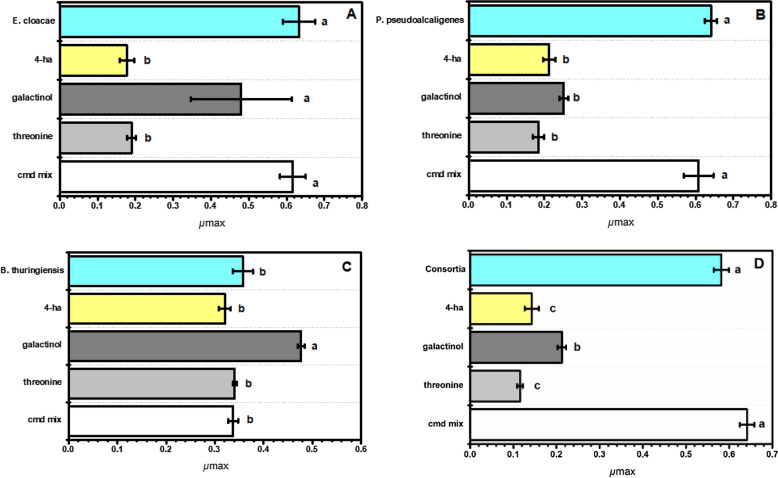
Figure 2.
Maximum specific growth rate (μmax) of P solubilizing bacteria incubated with different root exudates in phytin organic media. Each panel corresponds to (A) Enterobacter cloacae, (B) Pseudomonas pseudoalcaligenes, (C) Bacillus thuringiensis, (D) bacterial consortium. Y-axis shows from top to bottom the control: individual bacteria or consortium in blue; 4-ha: 4-hydroxybutyric acid in yellow; galactinol in dark gray; threonine in light grey; and cmd mix: compound combination in white. A one-way ANOVA was performed to compare the effect of root exudates on bacteria. Tukey’s HSD test for multiple comparisons show significant differences. Different letters denote statistical significance among treatments (p-value < 0.05).

