
FIGURE 4.
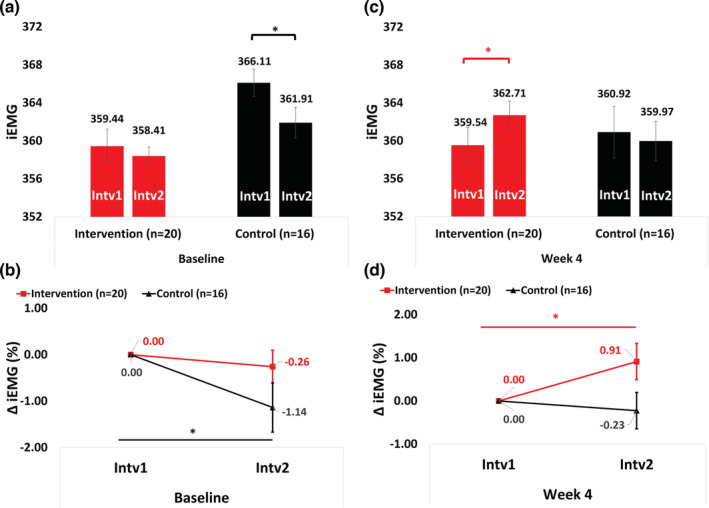
Gastrocnemius muscle endurance at baseline and 4 weeks within and between groups. iEMG, integrated surface electromyogram unit; Intv1, Interval 1 (0–5 min); Intv2, Interval 2 (55–60 min); Δ: delta. Generalized Estimating Equations were performed to assess the group × time × effect interaction of E‐Stim over GNMe (i.e., Intv1 and Intv2) within and between groups. Baseline (a) Absolute and (b) Normalized to 0% change Δ GNMe values ([GNMe at Intrv2 − GNMe at Intrv1]/[GNMe at Intrv1] * 100) in each time point. Four weeks (c) Absolute and (d) Normalized to 0% change Δ GNMe values ([GNMe at Intrv2 − GNMe at Intrv1]/[GNMe at Intrv1] * 100) in each time point. * Statistically significant (p ≤ 0.05).