
FIGURE 7.
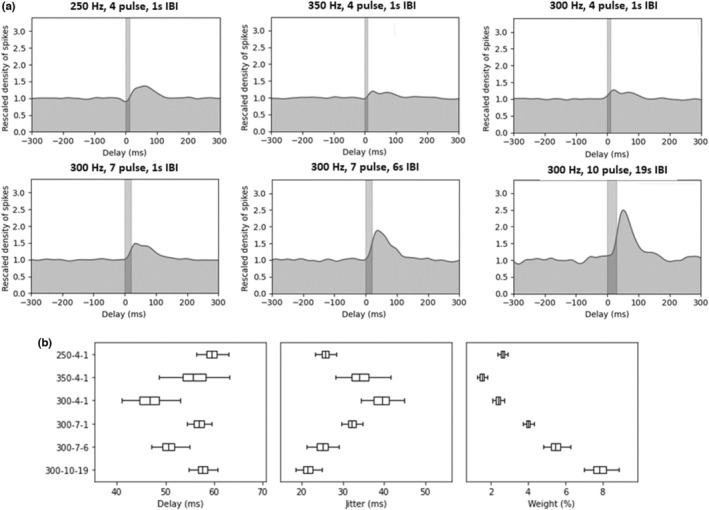
Evaluation of triggered responses in LC using bursting VNS. A spike density analysis was conducted to assess direct responses for each bursting paradigm. Baseline firing was rescaled to 1.0 across the 300 ms preceding pulse bursts. Bayesian parameter estimation was used to plot the direct response for each paradigm as a Gaussian distribution. While frequency does not have a large effect on the triggered response (a: top), higher numbers of pulses per burst and longer interburst intervals (IBIs) drive an increased triggered responses in the LC (a: bottom). (b) All paradigms show a similar delay (45–60 ms), with higher number of pulses and longer IBIs showing reduced jitter and higher weight. Further breakdown of weight assessment shows spikes per burst and spikes per stimulus. All boxplot graphs on the bottom row display 2.5, 25, 50, 75, and 97.5 percentiles for each paradigm. This direct response analysis was only conducted for bursting paradigms since standard paradigms at higher frequencies (20/30 Hz) have consecutive pulses overlapping the expected 45–60 ms delay window.