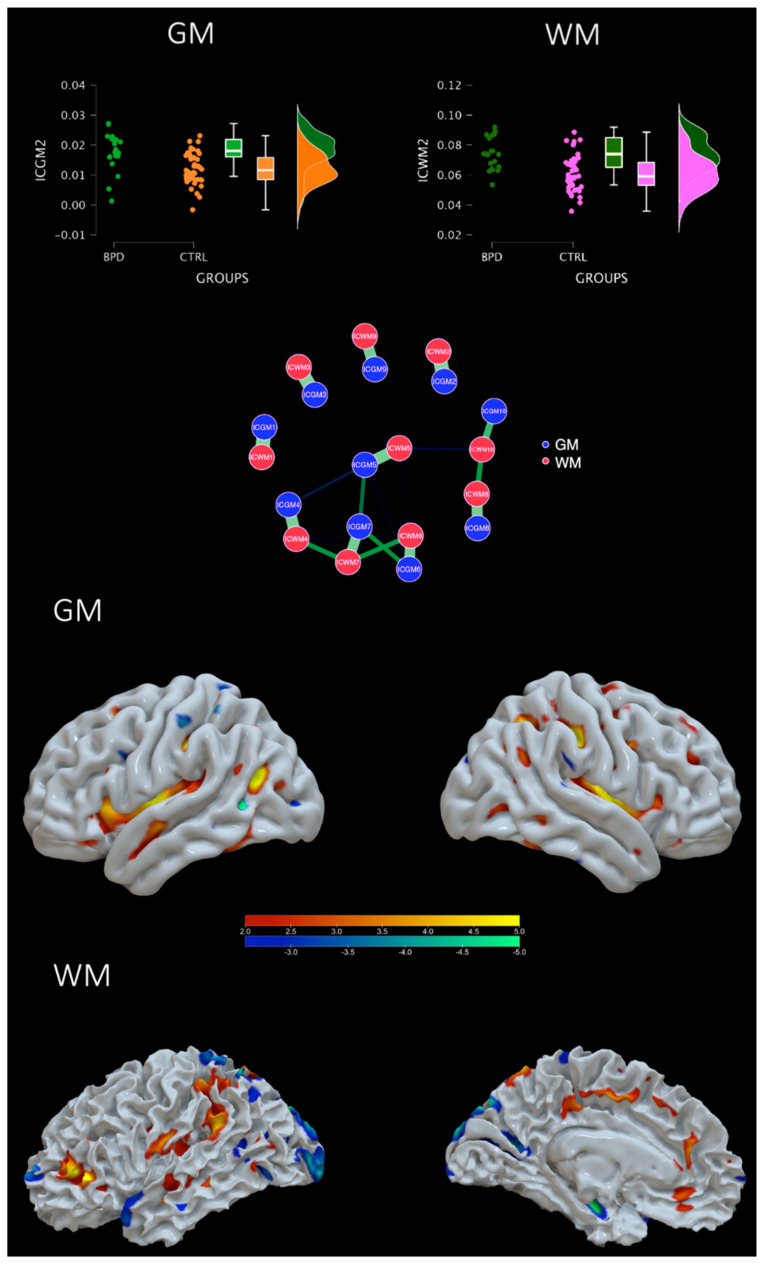
Figure 3.
A covarying GM-WM network that differs from BPD and HC. Top: violin plots of the loading coefficients for GM and WM of the IC2. Central: network plot showing in green the strength of correlations between components. Bottom: brain plot of positive (increased GM-WM concentration) and negative (decreased GM-WM concentration) of IC2.

