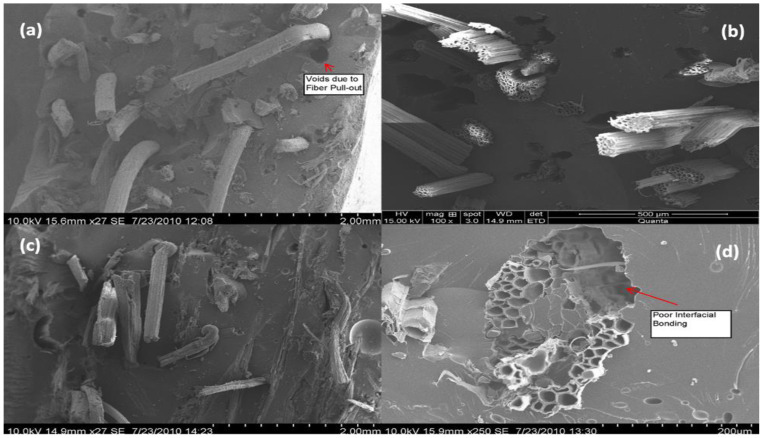
Figure 3.
SEM micrographs of fractured surfaces: (a) fibre pull-out during the tensile test; (b) cluster of bundles during the flexural test; (c) fibre breakage during the impact tests; (d) poor interfacial bonding [56] (reprinted with permission from Elsevier, License Number: 5446961080043).

