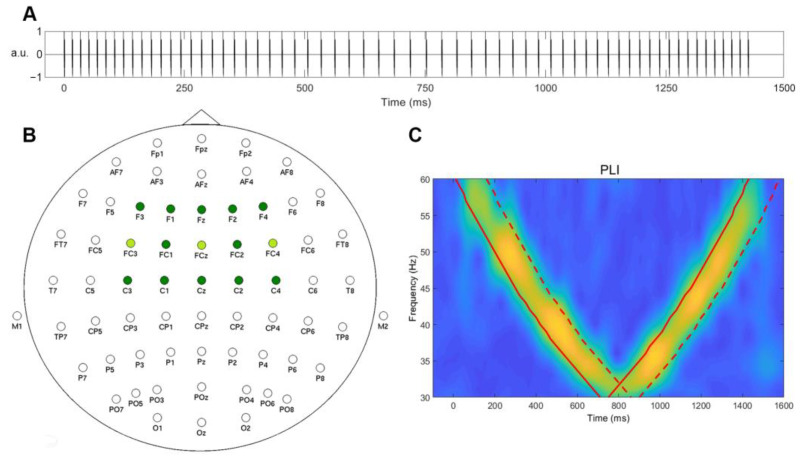
Figure 1.
(A) A schematic representation of the sound stimulus used in this study. (B) Electrode placement for 64- and 3-channel systems. Channels used for analysis are colored in green. (C) A schematic representation of time-window definition for the calculation of IGFs from PLI. The bold red line indicates the timing of the stimulation; the red dashed line denotes the edge of averaging window (+150 ms). a.u.—arbitrary units.

