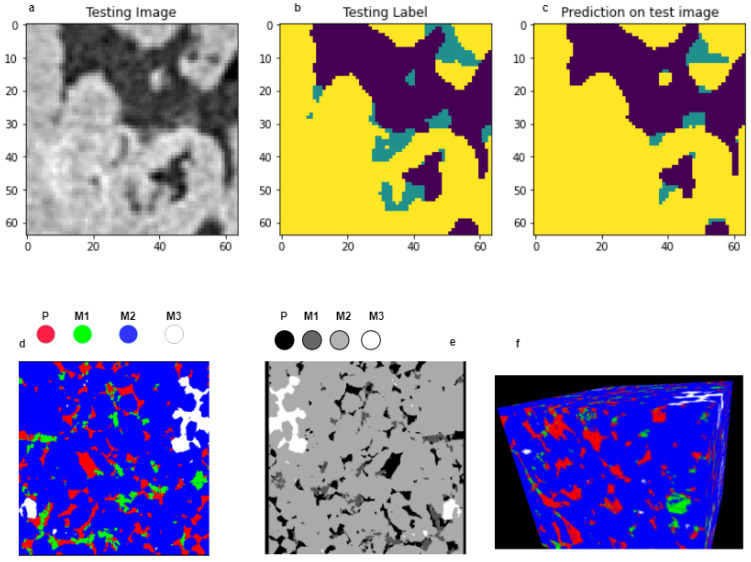
Figure 3.
Represents prediction, segmented sample both in 2D and 3D. (a) Test image of individual slice. (b) Test mask of individual slice. (c) Prediction on test image. (d) Two-dimensional (2D) representation of segmented result in RGB where the red area represents pores, lime is mineral 1, blue is mineral 2, and finally, white represents mineral 3. (e) Representation of segmented 2D result in grayscale. (f) Representation of 3D volume segmented result.

