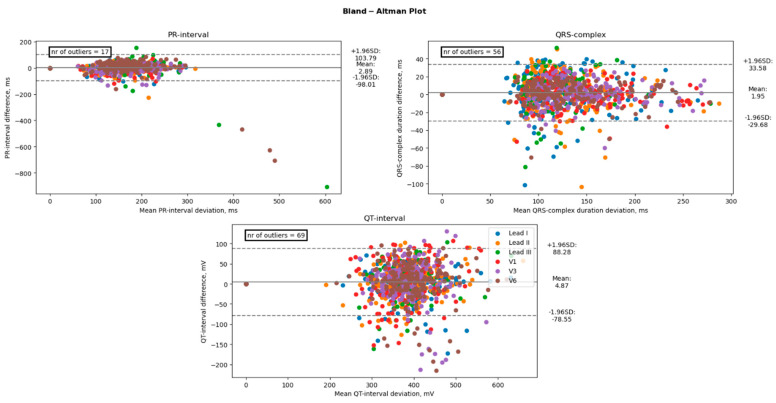
Figure 5.
Comparison of the duration between an Apple Watch and the standard 12-lead Electrocardiogram. The black line represents the bias (mean difference), and the dashed lines represent the upper and lower limits of agreement (1.96 SD). The number of points outside these limits is indicated. These differences are considered clinically significant.

