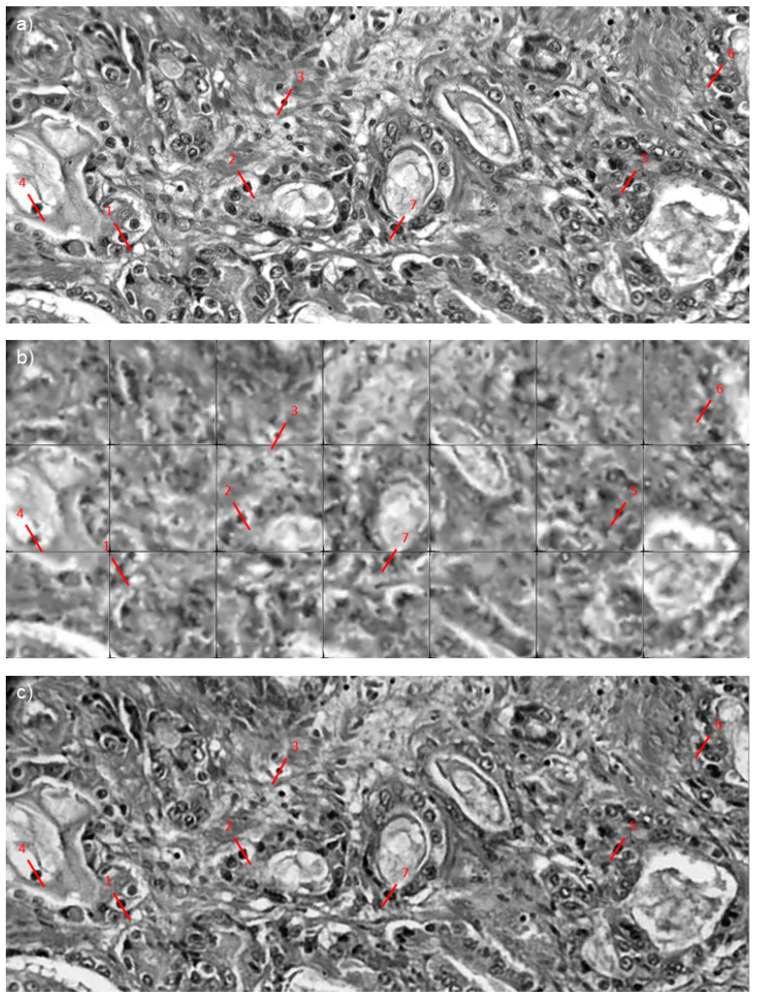
Figure 6.
SR reconstruction of slices taken from images prostate tissue (cancer and non-cancer) slide. (a) ground truth image. (b) Linear interpolation. (c) MFAE. Red lines represent line profile taken of cell nuclei, line numbering is equivalent to cell numbers in Table 2.

